


Today, organizations are embracing Lidar solutions more than ever for onshore and offshore applications for both the wind development and operational phases of a project. Whether assessing the blockage effect in offshore wind farms or leveraging inertial measurements and nacelle Lidar data for accurate wind-speed measurements on a floating wind farm, there are new and emerging use cases that illustrate how important Lidar is to the future of the industry.
The Advantages of Lidar
Today, Lidar offers many advantages over using met masts alone, which is why they are being so eagerly integrated into today’s surveying, planning, funding, construction, and operational practices. Advances in remote sensing technology have made Lidar more reliable and accurate, but Lidar is also mobile, relatively small, and non-disruptive to landscapes and environments. Lidar deploys rapidly, can be used temporarily, and is easy to repurpose after initial measurement, providing exceptional long-term value. Best of all, as turbines continue to grow larger, Lidar provides unmatched accuracy, range, and depth of data throughout all four stages of project development and operations, whether onshore or offshore: prospecting, assessment, monitoring, and optimization.
With thousands of real-world deployments and millions of hours of operation in the field, Lidar has become an industry standard for reliable and accurate wind measurement.
WindCube Nacelle Receives Full Classification
As the industry shifts and nacelle Lidars are established as a powerful tool for contractual power-curve testing, Lidar is becoming more widely accepted. Today, Lidar device manufacturers and the academic community are demonstrating that nacelle Lidar wind measurements maintain traceability to international standards, which have historically been based on cup anemometry, exhibiting readiness to further use nacelle Lidar for power performance testing (PPT).
The recently approved and published IEC 61400-50-3 standard addresses this nacelle Lidar application, providing clear guidelines on power-curve measurement campaigns according to industry best practices. According to the standard, a classification of each nacelle Lidar type is necessary to ensure IEC-compliant PPT. Leosphere, a Vaisala company that specializes in developing, manufacturing, and servicing turnkey wind Lidar instruments for wind energy, in collaboration with DNV, was the first to receive full IEC 61400-50-3 classification for its nacelle-mounted Lidar, WindCube® Nacelle.
WindCube Nacelle is already included in multiple developer and manufacturer turbine supply agreements, with more than 400 successful deployments. The new IEC standard paves the way for increased adoption and acceptance for state-of-the-art PPT campaigns in onshore and offshore environments.
As Lidar is increasingly embraced by players across the wind-energy sector, let’s take a look at how these versatile remote sensing solutions are being used in new ways.
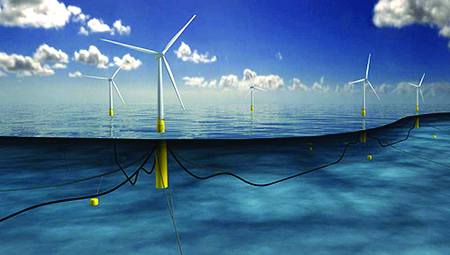
Hywind Scotland Collaborative Floating Wind-Farm Project
As offshore wind industry advances into deeper waters farther from coastlines, those on the leading edge are seeking opportunities to develop floating offshore wind projects and partnerships in selected markets.
However, new developments come with new challenges. To better understand and demonstrate the economic feasibility of floating wind-energy development, research projects and partnerships are exploring the use of nacelle Lidar data for accurate wind-speed measurements at floating offshore wind sites.
Equinor and IFP Energies nouvelles recently performed a collaborative project at Hywind Scotland, the world’s first commercial wind farm using floating wind turbines. The joint Hywind Scotland venture leveraged a time-domain turbulent 4D wind-field generator that uses Lidar measurement for accurate wind-speed measurements at the site, the success of which would open the door for loads, fatigue, and power performance measurements for floating turbines.
Power performance testing (PPT) and load calculation on floating designs is a significant challenge. Project developers want to retrieve wind properties, such as horizontal wind speed, rotor averaged-wind speed, turbulence intensity, or shears, that are available and accurate — but that are also already compensated from the induction zone, from the nacelle-induced motions and with turbines with constantly growing rotor sizes.
Nacelle Lidar processing solutions need to collect a range of measurements to overcome the Cyclops effect, blade blocking, and changes as the wind evolves toward the rotor. In addition, they have to handle the technology-related spatial filtering effect to retrieve, as best as possible, the wind-spectrum bandwidth that is harmful to the structures. Moreover, with floating designs, inducing noticeable nacelle motions (translations and rotations), comes a necessity to localize the Lidar measurement locations at each sample time. To achieve that, a motion record unit (MRU) set up in the nacelle is used in combination with adapted processing to accurately provide the radial wind-speed measurements and locations.
In this context, IFPEN developed, in collaboration with Equinor, a solution that can estimate the incoming full wind field, based on the Lidar measurements and the MRU outputs, thanks to a three-steps algorithm. First, a motion compensation step identifies and handles the changing Lidar positions and lines of sight induced by the nacelle displacements. This permits to estimate, in second step, a full space and time grid of wind vectors, through an Information Kalman Filter-based approach. Finally, the wind-velocity vectors at the rotor plane are derived.
In sum, combining pulsed Lidar sensing technology with adapted processing of raw data and MRU quantities can provide a reconstruction of highly accurate wind information, including hub-height wind speed, rotor-averaged wind speed, turbulence intensity, and wind direction.
The wind-energy sector can expect this development will improve both the representativeness of loads and fatigue computations, and the precision of wind properties used as input for power performance testing applications.
OWA GloBE Project Blockage Effect Assessment
The Global Blockage Effect in Offshore Wind (OWA GloBE) measurement campaign also uses some unique and innovative Lidar applications. A few years ago, developers were concerned about the discrepancy between energy-yield assessments at offshore sites, bringing the mysterious blockage effect into the limelight.
When a free stream hits an offshore wind farm, its flow slows down and diverts around the turbines, creating a blockage effect. One of the initial attempts at modeling this effect was to simply apply a loss factor to the first row of the wind farm or across the entire wind farm, revealing a dramatic devaluation (up to 4 percent) of the production estimation. Even more concerning, the industry didn’t yet have a reliable way of modeling this blockage phenomena.
Under the umbrella of Carbon Trust’s Offshore Wind Accelerator, a group of major offshore wind developers convened to ultimately improve our understanding of flow through a wind farm and get industry consensus to design the best wind farms in the future.
Likely the most extensive offshore measurement campaign ever conducted, OWA GloBE was designed to assess the multiple aspects of the Global Blockage Effect (GBE) at full scale and observe the atmospheric phenomena that drive it. The objective was to produce a comprehensive dataset that can be used as the industry benchmark for assessing and quantifying the impact of the GBE on energy production.
At three wind farms, the campaign uses six scanning Lidars in three dual-Lidar setups; a floating Lidar, which is being placed at various locations; a met mast, which is equipped with another vertical profiling Lidar; and an atmospheric boundary Lidar to get a representative free stream velocity and a quantification of the boundary layer height.
Since the scale of this effect is somewhere in the region of zero to 4 percent of the wind speed, it’s a very small phenomenon being measured. Consequently, it’s important to control the uncertainties and perform the calibrations as best as possible. But offshore, the platform is moving and tilting in time from both the vibrations and thrust of the turbine, so the team proposed a new method to calibrate and verify the scanning Lidar beam position by using a drone as a movable and controllable hard target. Instead of having to put up a mast or find some objects that are visible from each position, the researchers flew the drone into position and used it as a hard target, similar to how physical objects are mapped onshore.
By installing a dual-axis inclinometer, gyroscope, and accelerometer on the top of every scanning Lidar casing aligned with the axis of the feet, researchers were able to understand the pitch and roll of the system at high frequency at all times. Researchers flew a drone with the ability to perform real-time kinematics and used the RTK base station to send corrections to the drone in real time to improve its position accuracy. One researcher would fly the drone directly into the Lidar beam path while another technician monitored real-time measurements to determine where the Lidar beam hits the drone.
Once the field work was completed, the next step was to combine the drone data with the Lidar data. From there, the team worked to determine the timestamps where the drone was hit by the Lidar beam using a carrier-to-noise ratio (CNR) filter. The research group then found the timestamps from the high-frequency position of data of the drone and the line of site measurements from the Lidar and joined those two in time.
For each axis, the team was able to determine an alignment, both in the azimuth and the elevation, successfully demonstrating that you can actually use a drone in offshore environment as a controllable hard target for scanning Lidar calibration.
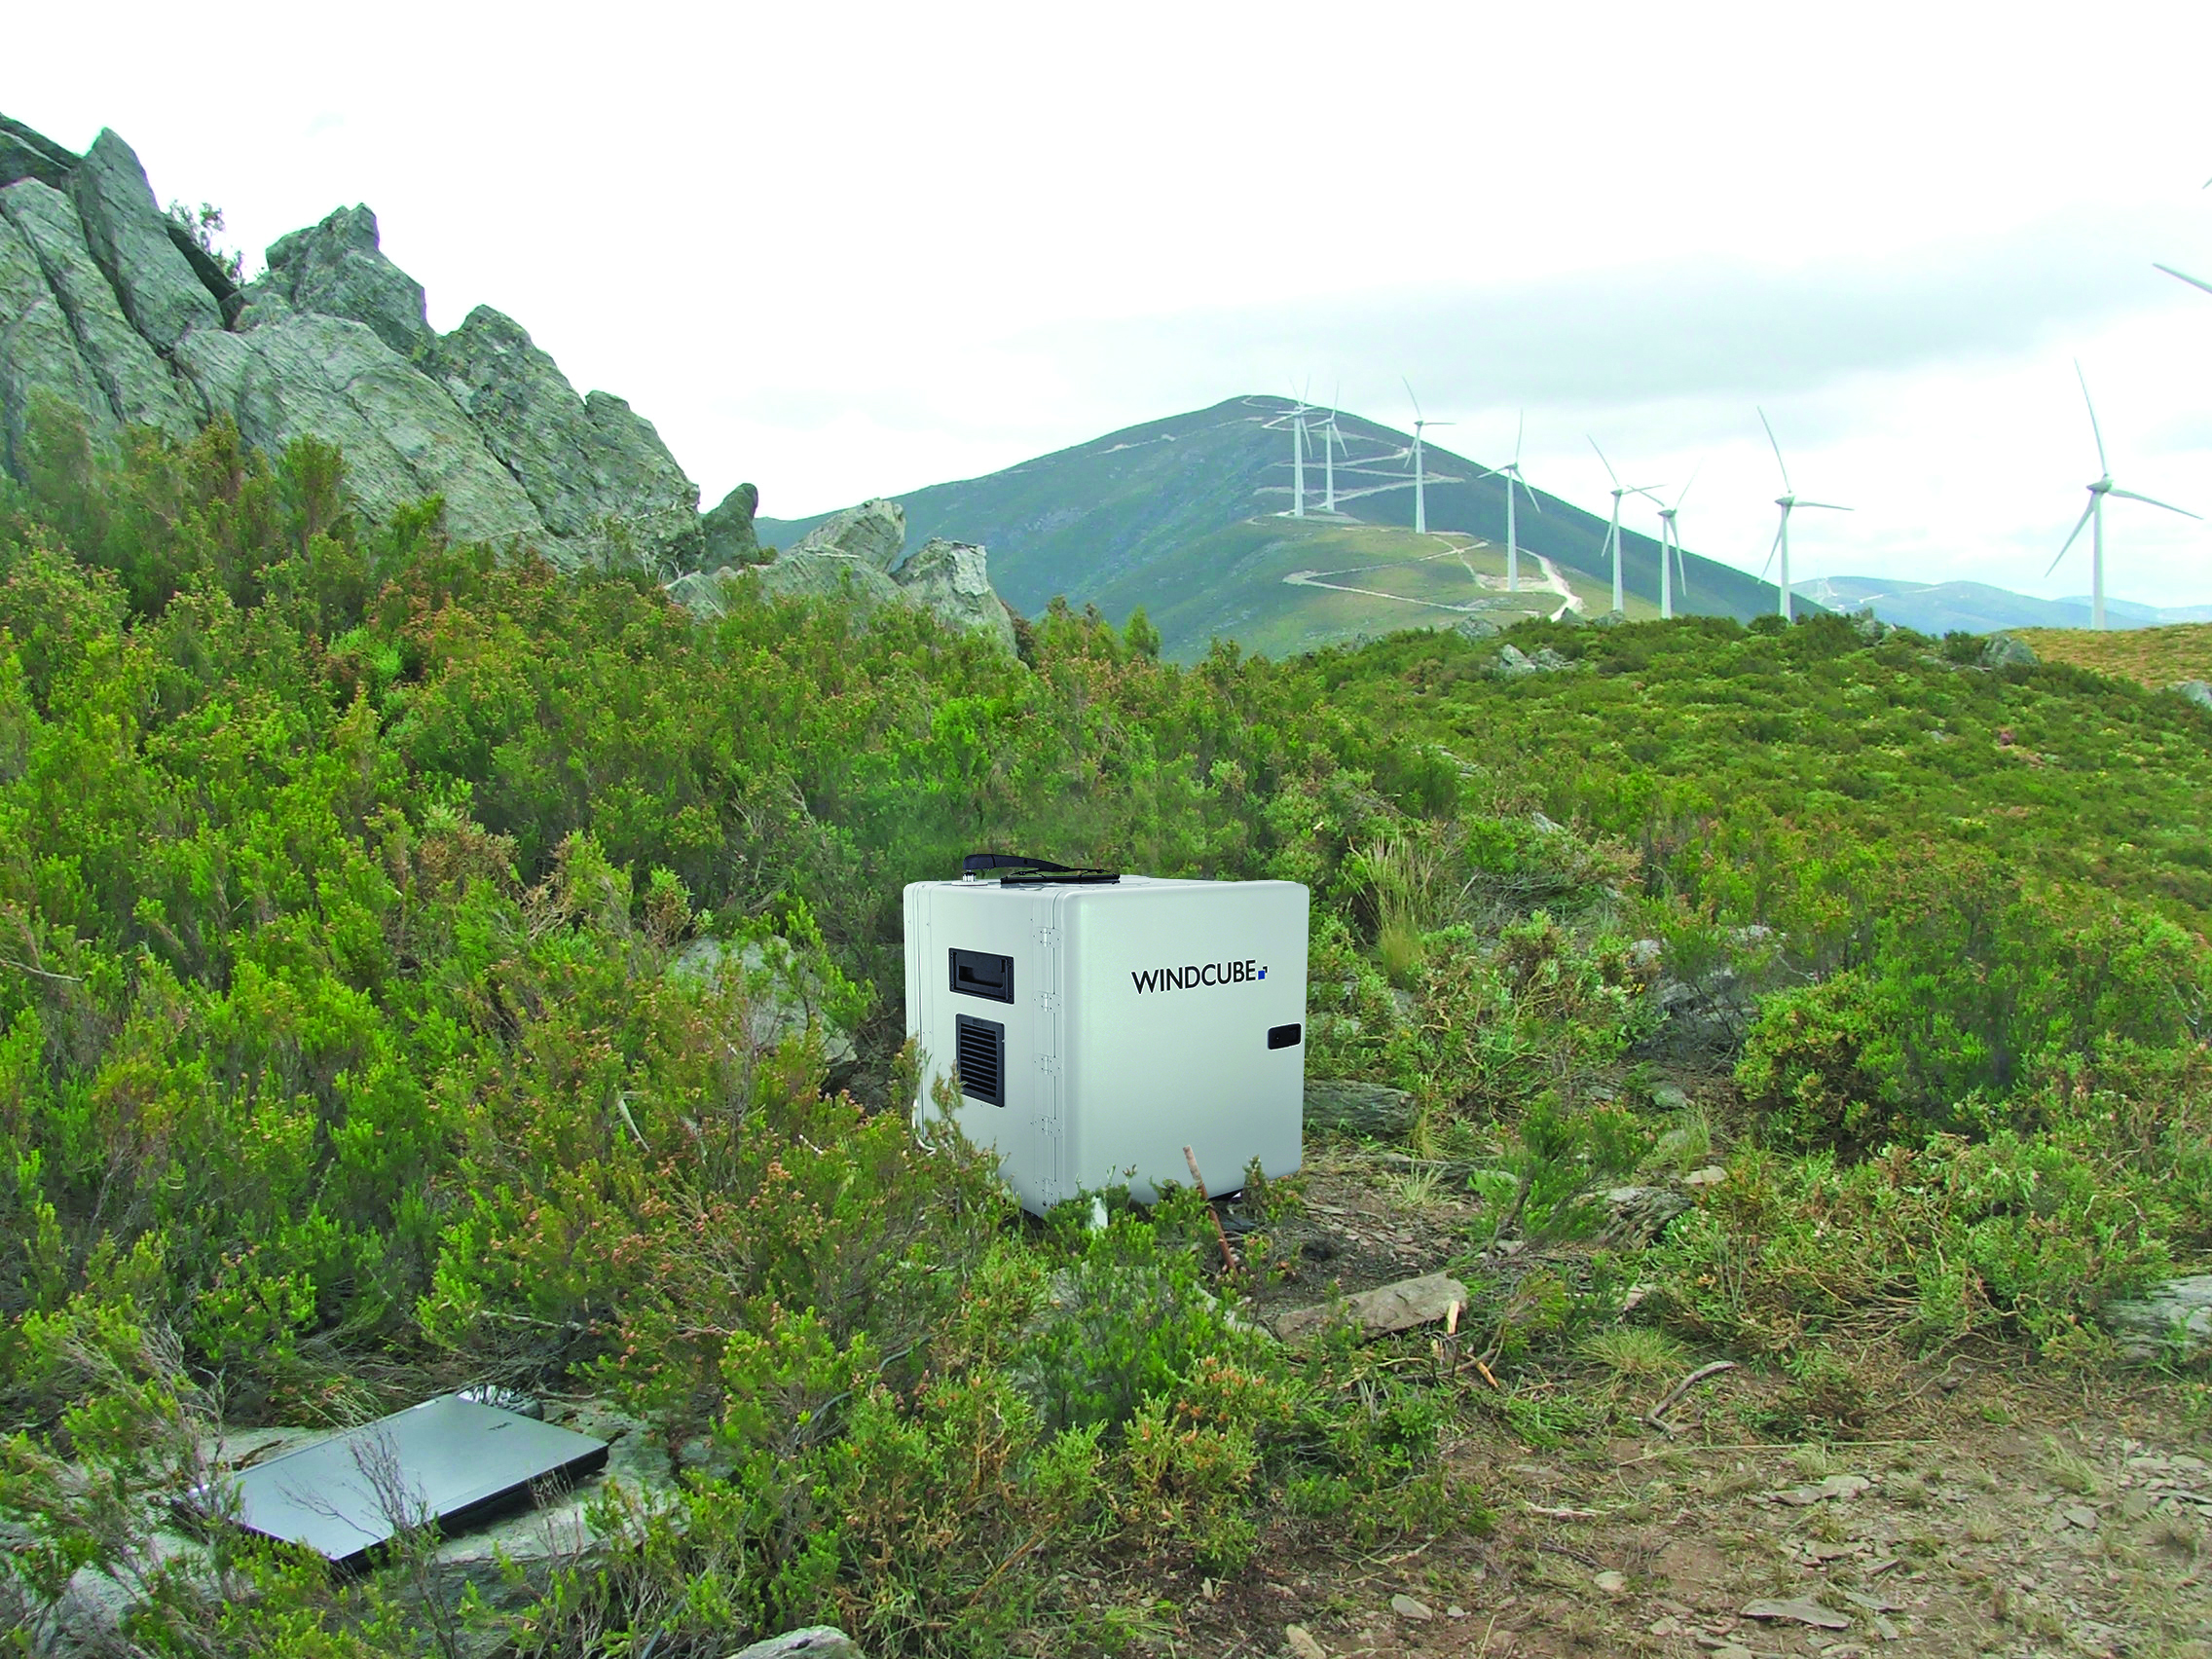
Terrain Complexity Estimation
Wind farms are increasingly being built in the mountains, foothills, and other complex terrain areas because many of the simplest sites are already taken. Lidar measurements of flows in these complex environments need post-processing corrections to use in bankable reports.
To help the wind industry understand the likely error at a given site, Leosphere has developed a unique tool for terrain complexity estimation. Starting with elevation model data, users can feed that elevation data to Leosphere’s proprietary neural network that has been trained on thousands of Lidar simulations in complex terrain. Each input node is a pixel from the elevation map, and each output node is the wind-speed error rate at a particular height in a particular direction.
The next step is to take these directional errors at a particular height and combine them with the annual wind roses from that particular location. By combining these directional errors with the API reanalysis wind-rose data, decision-makers can estimate the long-term wind speed error induced by the complex flow for that particular location. The Lidar-powered terrain complexity estimator tool can estimate wind-speed biases throughout complex terrain sites, empowering project owners to better optimize measurement campaigns, planning for a mixture of the flow complexity recognition (FCR) algorithm embedded in the WindCube vertical-profiling Lidar, CFD, and met masts, based on budget and the specific wind resources at the site.
Conclusion
We now have the necessary guidelines and standards that create global confidence, knowledge sharing, and standardization of Lidar as a critical and expected part of most standard wind-energy projects. While Lidar is already widely used in all phases of a wind project, there are clearly some new, emerging-use cases for the technology that are propelling wind energy into the future.
From hard-target calibration of scanning Lidar using drones in offshore environments to leveraging inertial measurements and nacelle Lidar data for measurements at floating wind farms to estimating possible complex flow Lidar-error corrections using a unique complex terrain estimator tool, it’s important that the wind-energy industry players understand how these versatile remote sensing solutions — in conjunction with other technologies — are being used to drive wind-industry innovation.


