Vestas recently received an order totaling 102 MW for two wind projects in Italy from long-standing partner Edison. The projects form part of a broader 400-MW frame agreement, with the remaining capacity to be confirmed and announced as it becomes firm and unconditional.
The order consists of the Andretta-Bisaccia project that will feature five V150-5.6 MW EnVentus wind turbines and 12 V150-4.5 MW turbines as well as the Rocchetta project that will include four V136-4.5 MW turbines. Both projects will be supported by a 10-year operation and maintenance service agreement, ensuring optimal performance and reliability throughout their lifecycle.
“Signing the frame agreement with Edison and securing the first two firm projects totaling 102 MW marks an important step in strengthening our long-standing partnership and we deeply appreciate Edison’s trust and collaboration,” said Francesco Amati, General Manager, Vestas Italy. “These projects also demonstrate the flexibility of Vestas’ product portfolio and our ability to combine different rotor sizes and power ratings to maximize value for our customers.”
“The continuous technological modernization of our plants is essential to achieving the objectives of the energy transition,” said Fabio Lamioni, CEO of Edison Rinnovabili. “At Edison, we are leaders in repowering processes in Italy and, thanks to our agreement with Vestas, a highly reliable partner with extensive know-how, we are accelerating our growth in renewables. Through new technologies, we will double the amount of green energy produced and drastically reduce the number of wind turbines, with clear benefits in terms of harmonizing our assets with the landscape.”
Turbine delivery and commissioning are expected in the fourth quarter of 2026.
GT Wings, the U.K.-based wind propulsion company behind the AirWing™ Jet Sail system, recently announced the close of a significant investment round led by Grieg Kapital, the investment arm of the Grieg Group.
Grieg Kapital invests alongside established investment partners, including Blackfinch Ventures and One Planet Capital, to support GT Wings’ growth journey. The investment marks a step forward in scaling next-generation wind-assisted propulsion for the global commercial shipping sector.
The investment will enable GT Wings’ growth plans, support the broader commercial deployment of AirWing, and accelerate the company’s global supply-chain and manufacturing readiness, as demand for wind propulsion increases with an evolving regulatory framework.
GT Wings, the U.K.-based wind propulsion company behind the AirWing Jet Sail system, announced the close of a significant investment round. (Courtesy: GT Wings)
“Wind-propulsion is emerging as a transformative technology for decarbonizing global shipping, and GT Wings has developed a practical, scalable solution that addresses real operational constraints for shipowners,” said Stian Grieg, Grieg Kapital.
“GT Wings’ strength lies not only in the solution but in the team behind it – drawing on cutting-edge aero- and hydrodynamic engineering backgrounds from F1, America’s Cup, and leading maritime and industrial companies, giving them the depth needed to scale AirWing,” said Jon Gjøsund of Grieg Kapital. The investment comes as shipowners face increasing pressure to cut emissions intensity, particularly under FuelEU Maritime, which will impose progressively tighter greenhouse-gas intensity requirements from 2025. Wind-assisted propulsion is one of the most cost-effective and immediate levers available to drive adoption across multiple vessel segments.
The market is at an inflection point. A DNV white paper on wind-assisted propulsion systems reports 52 ships already in operation and nearly twice as many newbuilds on order. With most installations so far focusing on retrofits, this surge in newbuild commitments signals both integration from the design stage and a faster pace of adoption ahead.
GT Wings’ AirWing is the first commercially available Jet Sail, a high energy-density wind-propulsion technology designed to deliver substantial fuel and emissions savings.
Its proprietary Jet Sail technology delivers industry-leading thrust performance with a compact footprint and minimal operational disruption, a key advantage for shipowners seeking high-impact, energy-saving solutions that do not adversely encroach on deck space.
Working closely with its global partners, GT Wings is preparing for large-scale installation volumes over the coming years, driven by strong demand signals and a rapidly expanding order pipeline.
“We are pleased to welcome Grieg Kapital as a new investor,” said George Thompson, CEO of GT Wings. “Grieg Kapital’s reputation for backing forward-thinking, sustainability-driven technologies aligns closely with our mission.
The group’s heritage stems from one of Norway’s most respected maritime industrial families and the investment strengthens our ability to scale AirWing, as demand for credible decarbonization solutions continues to grow.”
Netzsch Pumps USA, the complex fluid handling solutions provider, recently announced the launch of N. Durance tungsten carbide fusion coating technology, a surface treatment engineered to maximize the service life and reliability of NEMO progressing cavity pumps.
Developed through research and testing for abrasive and harsh applications, the N.Durance™ coating provides a long-term solution where uptime, durability, and cost efficiency are critical. Designed for highly abrasive and corrosive applications, N.Durance delivers a level of protection and performance far beyond traditional coating technologies such as hard chrome plating, HVOF, and plasma spray systems.
Developed through research and testing for abrasive and harsh applications, the N.Durance coating provides a long-term solution where uptime, durability, and cost efficiency are critical. (Courtesy: Netzsch)
The N.Durance series, available in Advanced, Pro, and Ultimate versions, enhances rotor durability and extends both rotor and stator lifetimes by leveraging a dense, homogeneous fusion coating with very low porosity. The manufacturing process achieves hardness, toughness, ductility, and cavitation resistance, minimizing oxidation and decarburization of tungsten carbide particles while improving the cohesiveness of splat layers.
This results in better cracking resistance, consistent wear protection, and reliable operation under extreme conditions. With a hardness of about 1,300 Vickers — among the highest in the industry — N.Durance delivers protection against friction and wear from abrasive fluids and solids common in applications for PC Pumps.
N.Durance delivers wear resistance, impermeability to gas and liquids, and improved corrosion protection, and replaces environmentally harmful hard chrome plating manufacturing processes. Unlike chrome plating, which produces carcinogenic hexavalent chromium, N.Durance employs an environmentally friendly manufacturing method that avoids toxic chemicals and hazardous waste.
The technology is manufactured in-house at Netzsch’s Exton, Pennsylvania, facility, ensuring consistent quality, controlled processes, and short delivery times. As the only progressing cavity pump manufacturer in the U.S. capable of producing and coating rotors in-house, Netzsch can machine and N.Durance-coat rotors in as little as one to two days, even offering same-day shipment when needed. All components are fully compliant with Build America, Buy America (BABA) requirements.
Ideal for industries handling abrasive slurries, corrosive fluids, and erosive environments, N.Durance improves the long-term reliability and efficiency of Nemo® Progressing Cavity Pumps. In municipal wastewater plants, this translates to longer maintenance intervals, reduced downtime, and improved system predictability. When paired with Netzsch’s smart monitoring solutions, such as Norius™, operators can access real-time data on pump performance for predictive maintenance and proactive service planning.
Lightning activity surged to an eight-year high in 2025, according to Vaisala Xweather’s Annual Lightning Report.
2025 saw 252 million lightning strikes, a 20 percent increase from 2024. Capturing more than 99 percent of thunderstorms worldwide, the network detected more than 2 billion global lightning events.
2025’s most active lightning day occurred on April 5, weeks ahead of the typical May-September season. In the contiguous U.S., 157 severe storms, including 21 tornadoes in the Southeast, produced more than 3 million lightning events on April 5, surpassing the annual totals of the 14 least lightning-prone states combined.
2025 saw 252 million lightning strikes, a 20 percent increase from 2024. (Courtesy: Vaisala)
“While there is no single weather causation for this lightning spike, the event reaffirms a need for increased measures to counteract the adverse effects of lightning,” said Ryan Said, Senior Scientist at Vaisala Xweather. “Improved lightning detection has helped decrease lightning-related deaths by almost two-thirds in the U.S.”
Shady Grove, Oklahoma, became 2025’s lightning capital with 3,005 lightning events per square mile. This marks the first time in four years that a lightning capital was named outside Texas or Florida.
Texas topped the nation’s lightning count in 2025 with 47 million lightning events, thanks largely to the sheer size of the state. When the numbers are adjusted for area, however, Texas drops out of the top five most lightning-dense states.
By lightning density, Florida takes the lead with 305 lightning events per square mile.
Lightning remains the leading cause of wind-turbine blade damage, costing the industry more than $100 million annually. Analysis of 68,000 turbines found nearly one third of U.S. wind turbines were struck by lightning in 2025. One Kansas wind farm recorded 3,235 strikes over 10 years, averaging 1.2 strikes per turbine annually.
Monitoring lightning and severe weather is crucial for keeping infrastructure operational. Vaisala Xweather’s real-time alerts keep communities safe and advanced lightning data helps customers identify the strikes most likely to cause damage to their organization’s assets. This accuracy allows for targeted inspections and repairs rather than costly, facility-wide shutdowns.
With a five-year supply agreement valued at about 250 million Swiss francs now in place, Gurit has become the core kit design partner for one of the world’s leading wind turbine OEMs.
Leveraging Gurit’s expertise and experience in optimized kit design, this partnership enables Gurit to provide OptiCore design services for all core kits covered under the agreement, whether supplied by Gurit or by third parties, ensuring consistency and continuity for the turbine manufacturer.
OptiCore performs thousands of simultaneous optimizations — balancing variables such as blade geometry, weight, resin uptake, permeability, and mechanical performance. (Courtesy: Gurit)
Gurit’s proprietary OptiCore parametric optimization platform is designed to advance the development of engineered core solutions for the wind sector. Through collaborative efforts between Gurit engineers and customers, OptiCore ensures that core usage and treatment are precisely optimized, with every groove, cut, and contour finely tuned to match the blade’s unique geometry.
“This significant long-term agreement reaffirms Gurit’s continued strength in the global wind energy market and the depth of trust we have cultivated with our customers,” said Jesper Sloth, VP Sales – Wind Materials, Gurit. “Our partners continue to depend on our innovative solutions that deliver measurable value, and this first major contract underpinned by the OptiCore platform further demonstrates our customers’ ongoing confidence in Gurit.”
This results in an optimized fit that reduces resin consumption, and therefore the cost and overall blade weight. Additionally, OptiCore provides a data-rich model of the blade core, which can eventually help optimize the structural integrity of the blade, aligning with the wind industry’s ongoing commitment to more sustainable energy generation at a lower levelized cost of energy.
By having one design partner for all core kits, the customer will benefit from a streamlined process, reduced complexity, unified designs across factories, and improved integration across their supply chain.
“Gurit’s PET extrusion and core kitting plants are strategically located near major wind turbine blade manufacturing facilities,”said Daniel Dahlqvist, General Manager — Business Unit Wind Systems, Gurit. “This proximity enables close collaboration with blade manufacturers, allowing rapid issue resolution and day-to-day optimization when new kits are introduced. Additionally, our global manufacturing footprint provides a more geopolitically stable supply chain.”
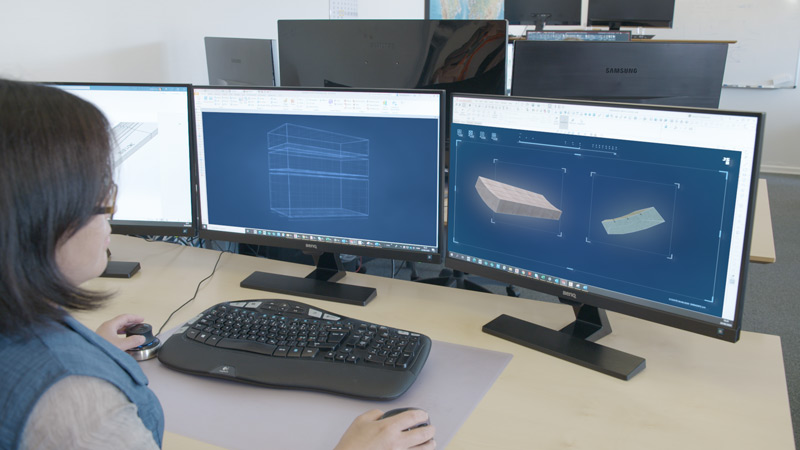
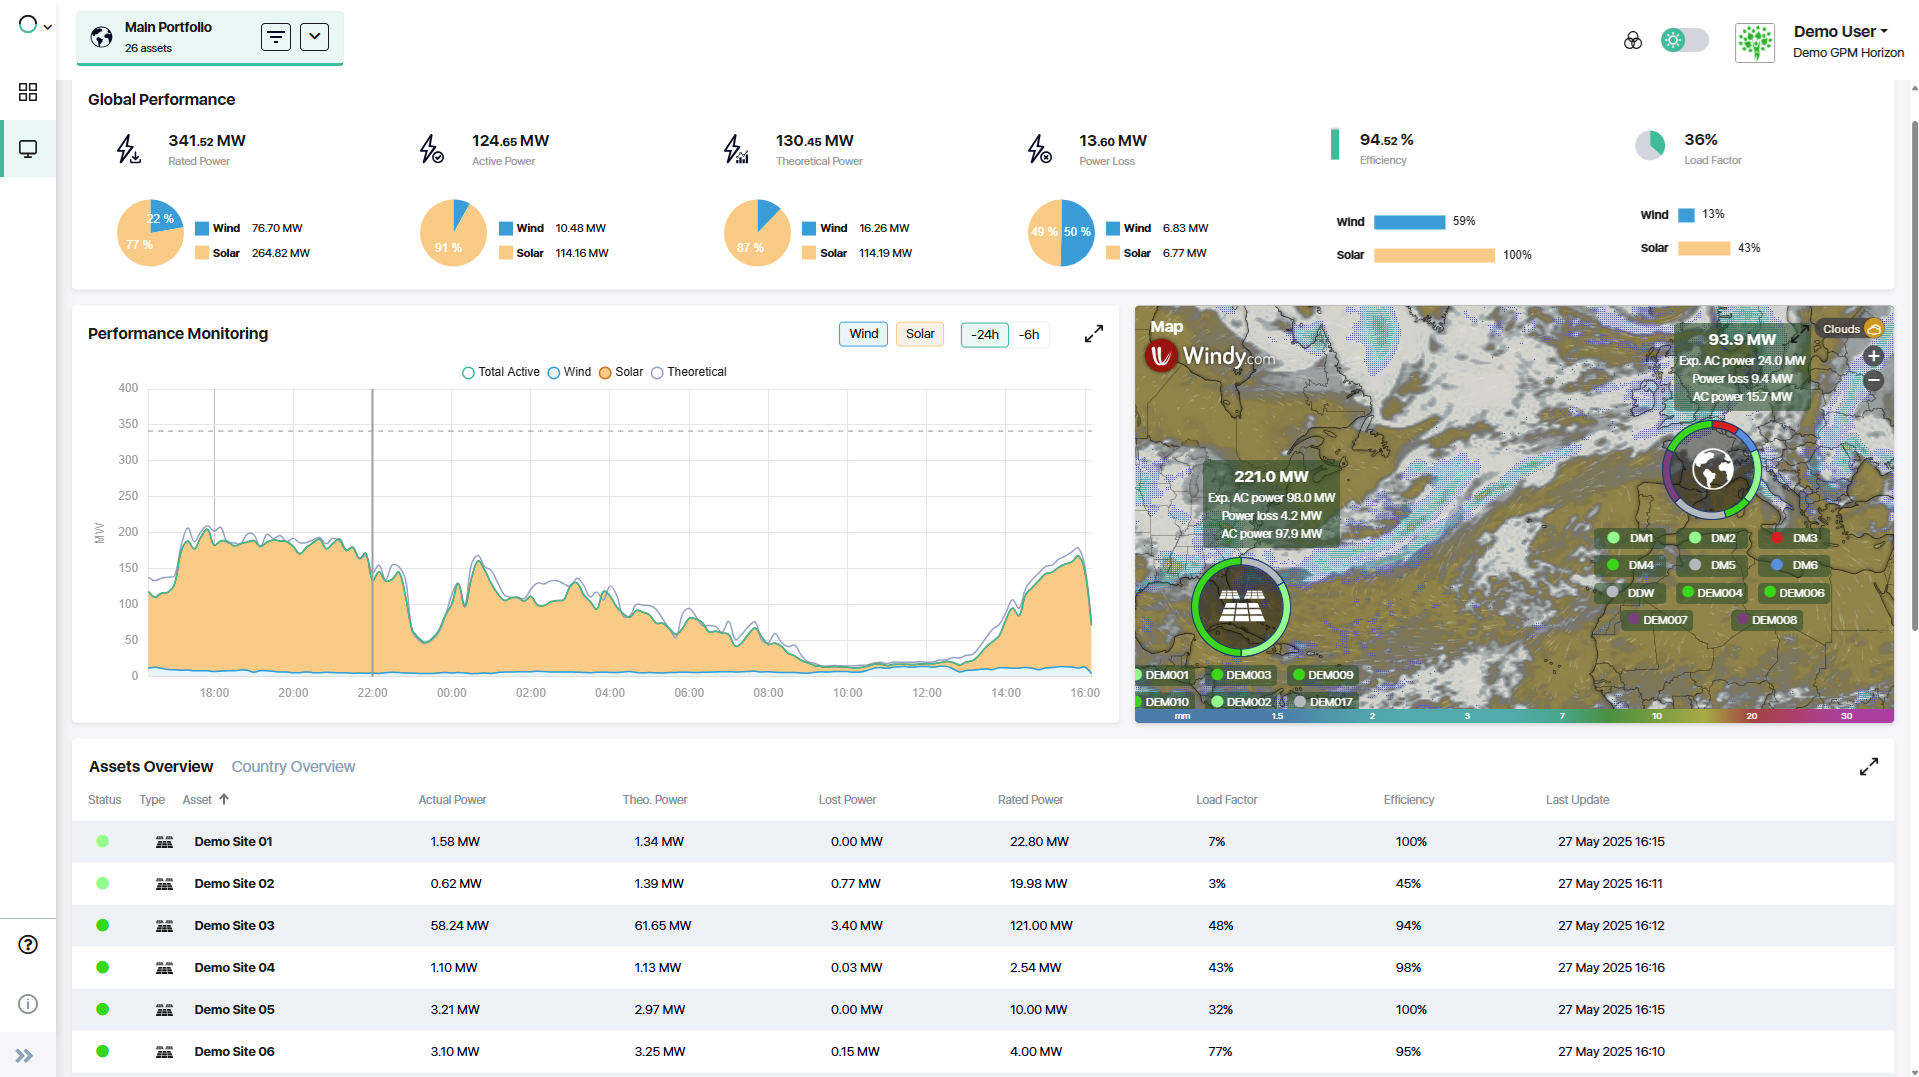
GreenPowerMonitor (GPM), a DNV company and leader in renewable asset monitoring, recently announced a new contract with Equinor, the international energy company, for use of GPM Horizon in its onshore renewable energy portfolio, which can enhance operational efficiency and asset performance.
Under a new global contract, GPM can offer its flagship platform, GPM Horizon (Elite), to centralize and harmonize operational data across a multi-technology portfolio, which includes wind, solar, and battery energy storage systems. The application is underway in Northern Europe, with potential expansion across all regions where Equinor operates.
Under a new global contract, GPM can offer its flagship platform, GPM Horizon (Elite), to centralize and harmonize operational data across a multi-technology portfolio. (Courtesy: DNV)
GPM Horizon offers a streamlined approach to monitoring and financial transparency, distinguishing itself by integrating all three technologies — solar, wind, and battery energy storage systems — into a single platform. It features AI-powered KPI categorization, predictive analytics, and customizable reporting, providing visibility and control across renewable assets.
“GPM Horizon exemplifies the power of data-driven decision-making in accelerating the energy transition,” said Juan Carlos Arévalo, Executive Vice President, Green Power Monitoring & Solutions, DNV. “By leveraging this platform, Equinor is not only streamlining operations but also unlocking deeper insights into asset performance and financial analysis.”
GPM Horizon enables Equinor and its subsidiaries to centralize operational data across a wide range of technologies and geographical locations, allowing for more streamlined and efficient management. It supports the optimization of asset performance and operational workflows, helping teams to work more effectively. By harmonizing data and processes, it simplifies tasks for both teams and asset managers. Additionally, it enhances financial analysis by providing accurate calculations of energy loss and revenue, contributing to better-informed decision-making.
Cybersecurity and data sovereignty are core to GPM’s offering. All operational data is securely stored in Europe, aligning with GPM’s commitment to robust data protection and compliance.
“This collaboration reflects GPM’s global-local model, combining international scale with local expertise; Equinor’s teams benefit from GPM’s deep domain knowledge and hands-on support, ensuring seamless integration and long-term value,” said Anders Husby, DNV global key account director responsible for Equinor. “At this level, it’s all about the data and what it enables you to do, GPM Horizon is designed to meet the complexities of managing global, multi-tech portfolios, helping customers like Equinor make faster, smarter decisions.”
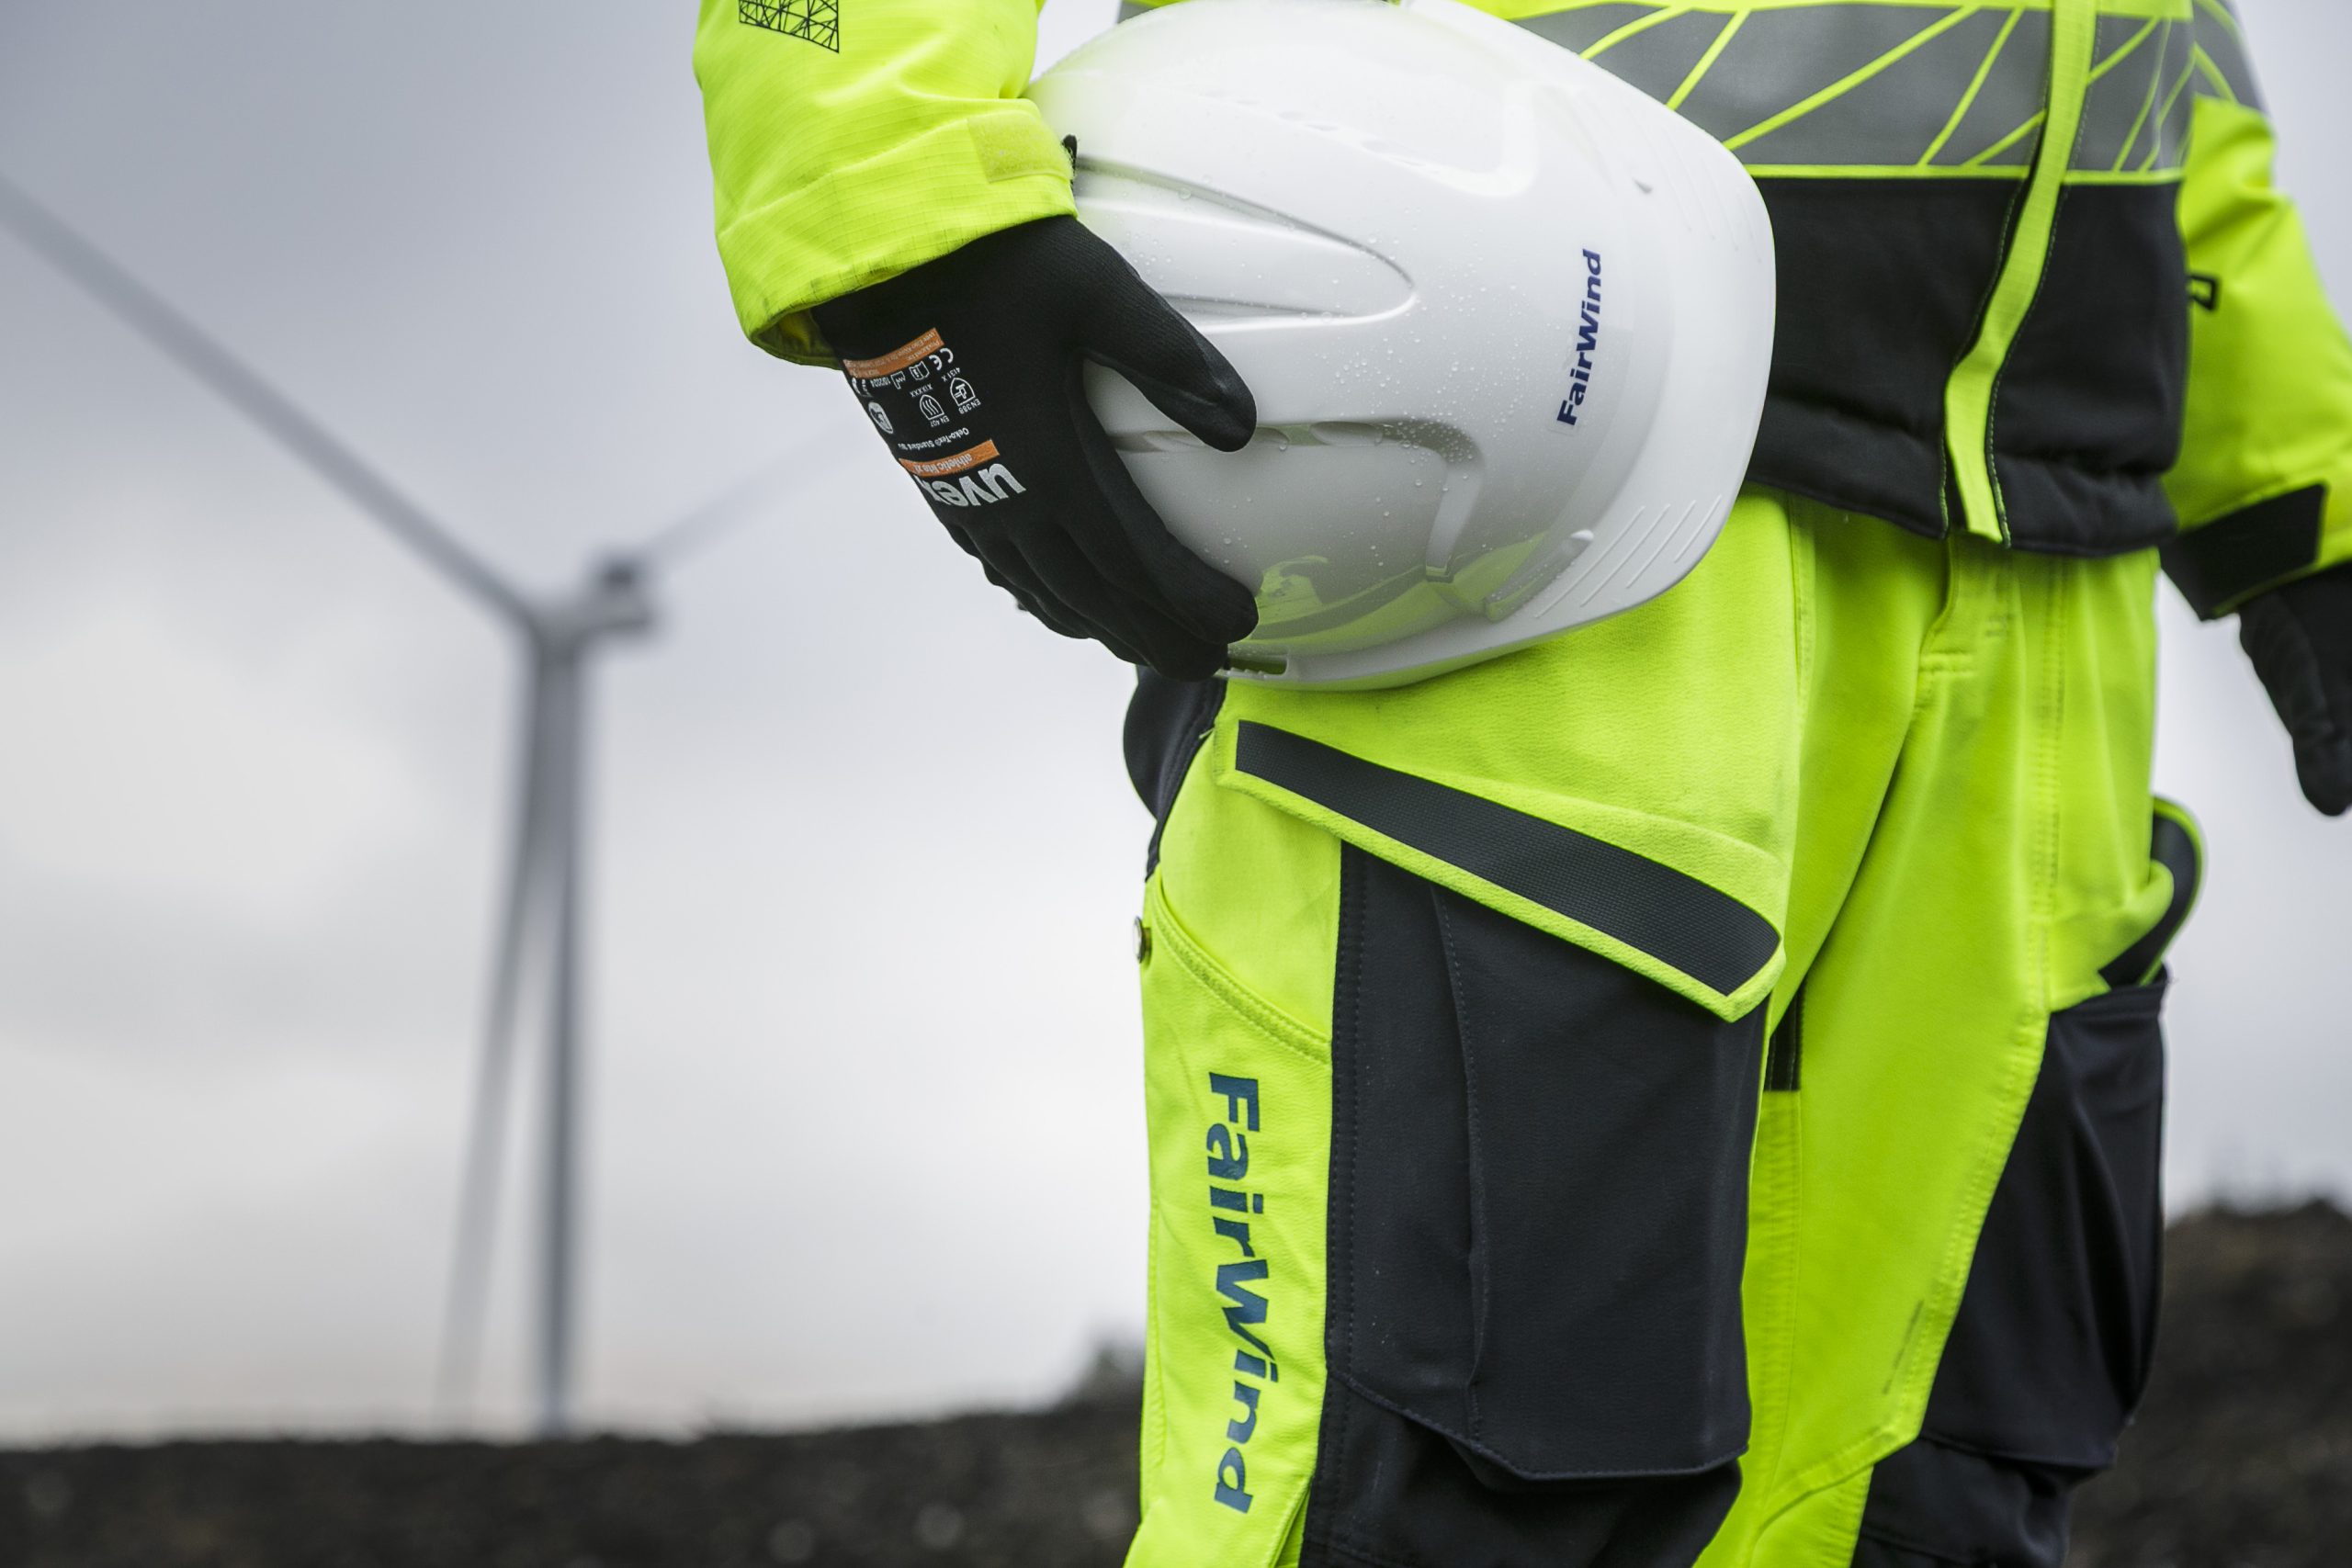
FairWind has been awarded a contract by Vestas to deliver the full installation scope for 44 turbines at Sanquhar II wind farm in Scotland.
Sanquhar II, in Dumfries & Galloway and East Ayrshire, is a major extension of the existing Sanquhar onshore wind farm.
FairWind will deliver the installation of 44 Vestas EnVentus turbines at Sanquhar II Wind Farm. (Courtesy: FairWind)
Developed by CWP Energy Ltd, the project will be the fourth largest onshore wind farm in the U.K. and constitutes one of the largest investments in U.K. energy infrastructure.
When completed, Vestas’ EnVentus wind turbines will power more than 335,000 homes annually and offset roughly 540,000 tons of CO2 every year.
Construction is already underway, and operation is anticipated to commence in 2027 and is expected to generate 1.2 TW/hr of electricity per annum once fully operational.
FairWind will deliver WTG installation services. The workforce will include a combination of global experts and locally hired technicians, with a mix of both experienced and entry level technicians to actively support the development of a local skilled workforce.
Sanquhar II wind farm presents unique challenges with mountainous terrain and significant distance between turbine locations.
FairWind will use expertise from recent installations across Northern and Central Europe, with a focus on smooth project execution from start to finish through effective workforce planning, quality and safety management, proactive communication and early risk identification.
“We are proud to bring our global experience and technical capability to such a milestone project for Scotland’s renewable energy sector,” said René Damgaard, UKIE Regional Director at FairWind. “Our teams are focused on delivering the highest standards of precision, safety and quality and we are committed to ensuring the project is completed efficiently and responsibly. This contract further strengthens our long-standing partnership with Vestas, and we look forward to supporting the successful delivery of such an important onshore wind development. Onshore wind remains one of the most cost-effective sources of clean energy and will play a central role in the U.K.’s energy transition. Once operational, Sanquhar II will provide reliable, affordable and homegrown power at a time when energy security has never been more important.”
FairWind, founded in 2008, has built its global reputation through strong project delivery, deep technical expertise, and a commitment to high HSEQ standards.
With more than 2,200 people globally, FairWind supports installations, maintenance, training, and full lifecycle services for turbine assets.
Casa dos Ventos, one of Brazil’s largest renewable energy companies, and Vestas, the global leader in wind-energy solutions, announced a new stage in their business partnership for renewable projects in Brazil, with an 828-MW order for the Dom Inocéncio wind complex. The project is in the south-central region of Piauí – a state recognized for its strong wind resources and one of Brazil’s fastest-growing renewable energy hubs.
Casa dos Ventos and Vestas announce a 828 MW order for the Dom Inocêncio wind complex in Brazil. (Courtesy: Casa dos Ventos)
The project will feature 184 V150-4.5 MW turbines, reinforcing the collaboration of more than eight years between the two companies and contributing to the sustainable expansion of Brazil’s energy matrix. Construction is expected to begin in 2026, with final commissioning scheduled for 2028. In addition to supplying the turbines and managing the construction project, Vestas will be responsible for operation and maintenance services for 25 years under an Active Output Management 5000 (AOM 5000) service agreement.
This announcement marks the first major move in Brazil’s wind market since 2023, signaling the return of large-scale investments and Casa dos Ventos’ confidence in cutting-edge technologies to support its expansion portfolio.
The project represents a total investment of over BRL 5 billion and will be one of the largest wind complexes in the country, capable of generating enough energy to power approximately 2 million homes. It will significantly strengthen Brazil’s energy security, increase the share of renewables in the energy mix, support the state’s socio-economic development, and stimulate the entire wind energy value chain through technical services, engineering, innovation, and professional training. Additionally, the project is expected to create more than 8,500 direct and indirect jobs during construction and operation, boost local supply chains, and bring direct and indirect benefits to the region.
“Through our partnership with Vestas, we are bringing solutions that deliver the reliability and performance required for a project of this magnitude,” said Lucas Araripe, Executive Director of Casa dos Ventos. “This new agreement is yet another demonstration of our commitment to supporting the expansion of Brazil’s renewable energy matrix. In addition to driving the country’s energy transition, our investment will also significantly boost the socio-economic development of the region.”
“Receiving Casa dos Ventos’ trust once again for a project of this magnitude is a great source of pride for us. Casa dos Ventos is a key player in expanding renewable generation in Brazil,” said Eduardo Ricotta, President of Vestas for Latin America. “It is an honor to support a partner that shares the same ambition: to develop projects that drive the energy transition, expand access to clean energy, and foster socio-economic growth in the regions where they operate.”
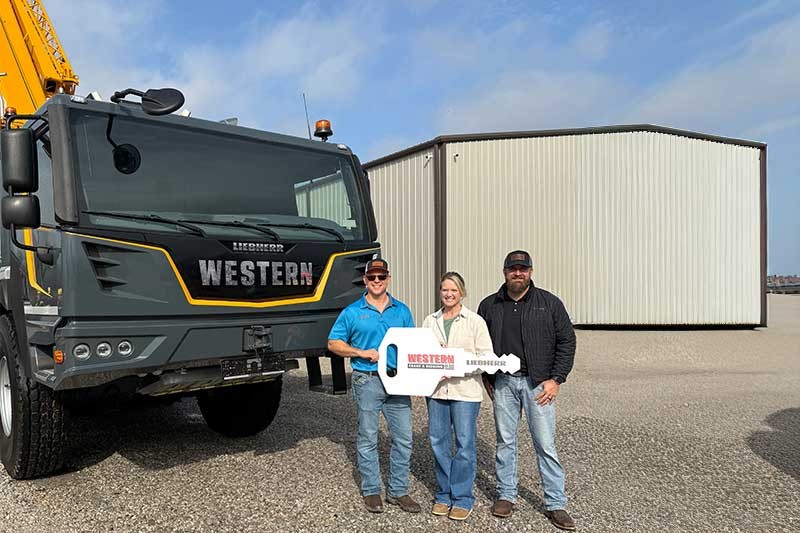
Western Crane & Rigging, Inc., a Kentucky-based crane company, expanded its fleet with the delivery of a Liebherr LTM 1100-5.3 mobile crane. As the first Liebherr crane in Western Crane & Rigging’s fleet, the crane signifies the start to a strong relationship between the two family-owned businesses.
Family owned and operated since 1987, Western Crane & Rigging has delivered trusted crane, rigging, and lifting services nationwide, earning its place as a premier crane service company in the region. The team at Western Crane & Rigging specializes in turnkey lifting, rigging and millwright in addition to steel fabrication services for industrial, commercial and infrastructure projects. With the rise in data center work, Western Crane & Rigging was looking to invest in equipment more tailored to the application.
The LTM 1100-5.3 mobile crane is the first Liebherr mobile crane in Western Crane & Rigging, Inc.’s fleet. (Courtesy: Western Crane & Rigging)
“We chose Liebherr because of the unmatched quality of their machines and the level of customer service their team consistently provides,” said J. David Fields, co-owner of Western Crane & Rigging.
“We have a wonderful team behind us that has helped to make this investment possible,” said Jessica F. Holcombe, co-owner of Western Crane & Rigging. “And Liebherr’s reliability, attention to detail, and commitment to supporting customers made our decision an easy one.”
In addition to the LTM 1100-5.3 mobile crane, Western Crane & Rigging has two additional Liebherr cranes on order, an LTR 1220 telescopic crawler crane and an LR 1400 SX crawler crane.
The LTM 1100-5.3 mobile crane is designed to provide mobility, economy, and performance, earning it the title of “master of all roads.” It features a telescopic boom and can carry up to 37,250 pounds. (16.9 tons) of ballast on public roads, making it more flexible on site and between projects.
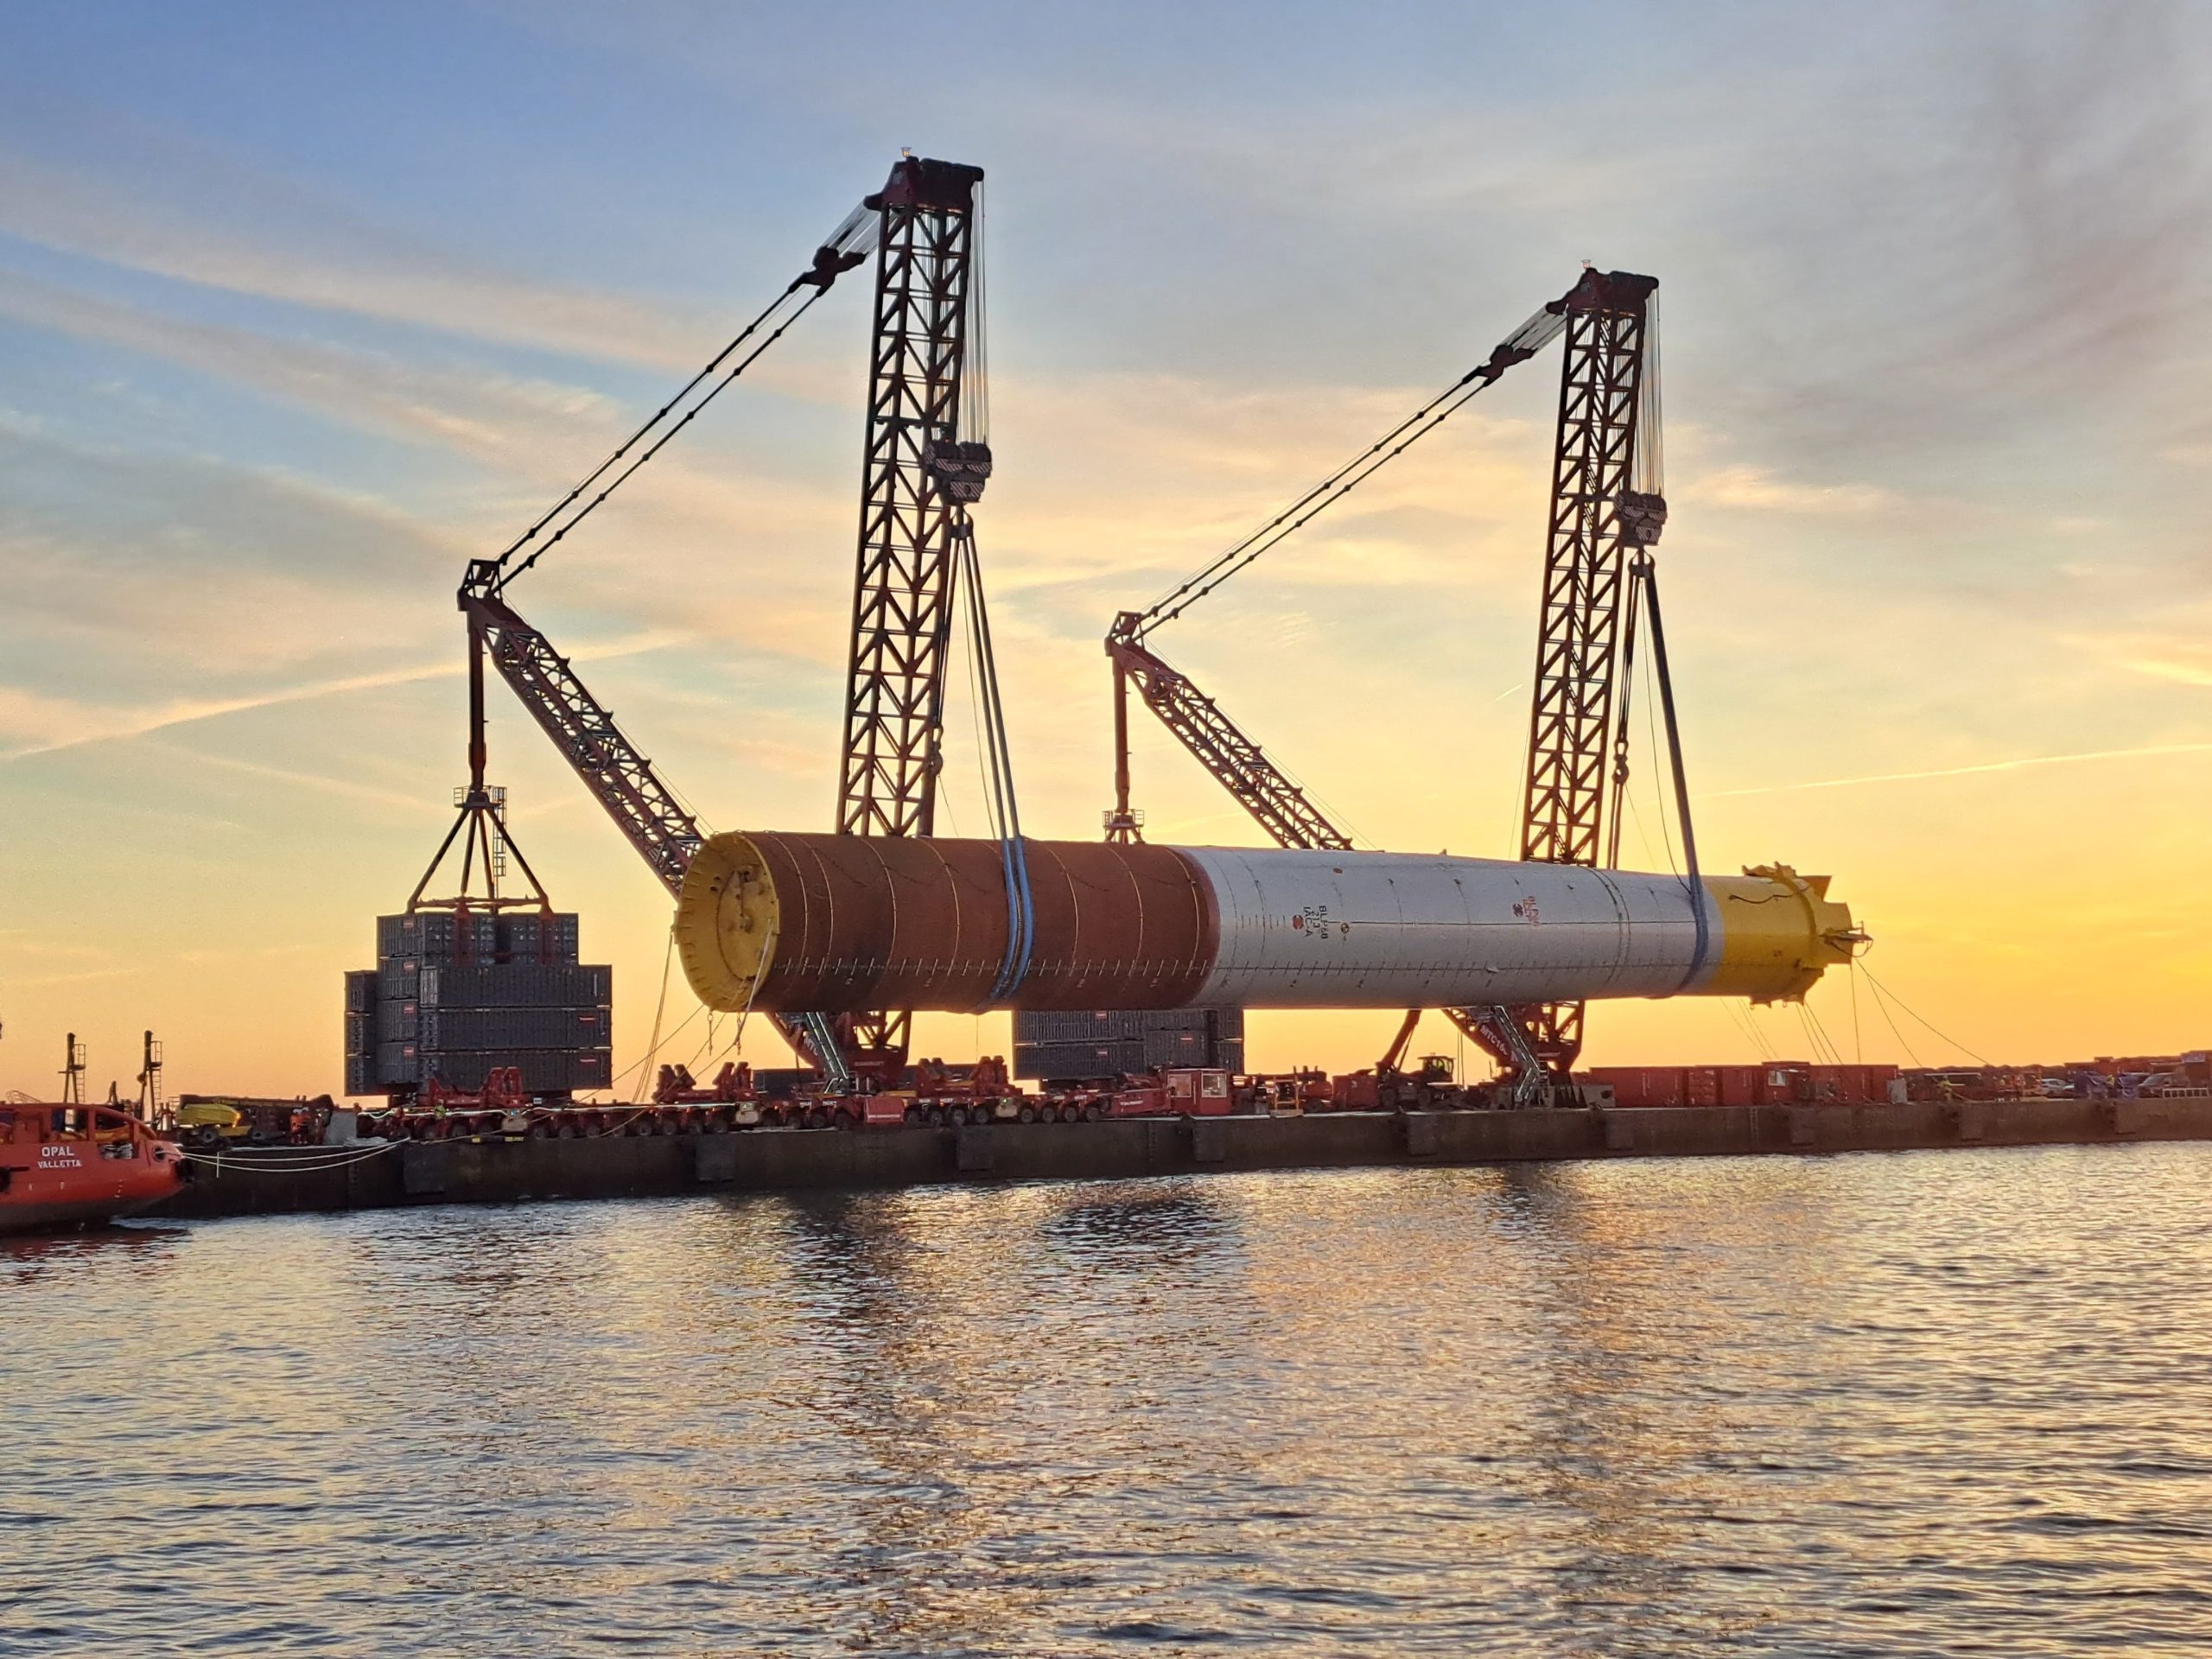
Mammoet has engineered an upgraded terminal crane and SPMT saddles to safely handle XXL monopiles for Windanker offshore wind farm.
Wind-turbine sizes are increasing at an unprecedented rate and for clear reason: The bigger the turbine, the more power it can generate and the fewer are needed per wind farm.
Taller turbines require larger foundations to withstand heavier winds further out to sea, but as these foundations grow, they are becoming increasingly challenging to lift and transport.
As an expert in handling heavy items safely and efficiently, Mammoet has come up with ways to make the movement of XXL monopiles faster and more cost-effective. (Courtesy: Mammoet )
As an expert in handling heavy items safely and efficiently, Mammoet has come up with ways to make the movement of even XXL monopiles faster and more cost-effective.
While it is theoretically possible to place monopiles into the sea using large crawler cranes, those required to meet the lifting capacity of the installation vessel would have been too big; requiring more space than was available at the port, and also reinforcement of its ground.
Mammoet engineered an upgraded terminal crane that can lift mega monopiles into the water for offshore feedering, and a specialist patented jacking-and-cradle system for their safe handling, using its SPMTs.
Mammoet’s equipment transformed the port of Ronne, Denmark, into a seamless assembly line; where monopiles were efficiently offloaded, stored, capped and then lifted into the water and no civil work was needed to reinforce the quay.
This value was demonstrated during the marshaling scope for Windanker GmbH’s 315MW Windanker offshore wind farm, which was being fed by Van Oord in the German waters of the Baltic Sea.
The transport and installation of the 21 monopile foundations were overseen by Van Oord, with Mammoet supporting their onshore lifting and transport.
The monopiles arrived at the port of Ronne from Spain, shipped in seven batches. The heaviest monopile weighed 2,150 tons and measured approximately 87 meters in length.
Fitted with Mammoet’s XXL monopile transport system, 90 axle lines of SPMT lifted them off their grillages and cradled them securely as they were driven off the vessel.
They were then taken to a temporary storage location and placed onto sand bunds, ready to be called off for capping to make them watertight.
The added stroke of the XXL monopile transport system allowed the monopiles to be lifted higher so that the indents of the storage bunds could be deeper, improving their support while using fewer materials. Next, at the capping location, a large LR1750 crawler crane installed plugs onto the top and bottom ends of each monopile.
Once both plugs were installed, the monopiles were driven to the quayside in front of the two MTC1600 cranes, which Mammoet developed to lift XXL monopiles onto vessels and into waters.
Once each monopile was safely in the sea, it was towed using tugs to Van Oord’s specialist heavy lift installation vessel, the Svanen, which was ready in the field to lift and install it into the seabed.
“We made a completely new crane design for this project, which is not typical but something we felt was necessary with the growth of monopile foundations,” said Stefan de Vries, project manager at Mammoet. “Initially, it was planned that the cranes would lift 2,800 tons, but we suggested their maximum capacity match that of the Svanen, to ensure consistent limits across the project. So, we increased their combined lift capacity to 3,200 tons.” With the ballast weight of the MTC crane positioned much further away from the pivot point of the boom, in comparison to a large crawler crane, the load-bearing pressure was far less. This helped to spread the load over a greater distance, avoiding the need for specialist foundations or temporary civil work.
Thanks to the efficiency of crane lifting, the Svanen could remain in the field and be constantly fed monopiles.
An international study, featuring CMCC scientists, reveals that the true economic damage of climate change has been vastly underestimated — because the ocean has been left out of the equation. By integrating the latest ocean science into climate-economic models, researchers found that accounting for climate impacts on marine ecosystems and ocean-dependent infrastructure nearly doubles the social cost of carbon. The hidden ocean cost is estimated at $48 per metric ton of CO2, a figure that should be added to current policy calculations.
The social cost of carbon — the monetary value that climate economists associate with the damage caused by emitting each additional metric ton of CO2 — has, to date, guided climate policy, carbon pricing, and cost-benefit analyses around the world. But there has been a major blind spot: the ocean.
The study finds that ocean-related damages are unevenly distributed across regions. (Courtesy: Shutterstock)
Impacts on marine ecosystems
A new paper involving CMCC scientists Francesco Granella, Johannes Emmerling, and Massimo Tavoni shows that when the impacts of climate change on marine ecosystems and ocean-dependent economic activities are properly accounted for, the cost of carbon causing climate change rises dramatically.
Using the latest ocean science and economic modeling, the study introduces the concept of “ocean-based social cost of carbon,” or blue SCC, capturing climate damages to coral reefs, mangroves, fisheries, and global seaports.
The researchers estimate the blue social cost of carbon at $48 per metric ton of CO2, a figure that should be added to existing estimates of the social cost of carbon. This estimate is based on a standard “business as usual” scenario, in which no additional climate policies are implemented and climate change continues along its current trajectory. When compared with the values used in policy frameworks across countries, the results show that accounting for ocean impacts nearly doubles the social cost of carbon.
“The social cost of carbon puts a monetary value on the damage caused by emitting one additional (metric ton) of CO2, making it a practical tool for cost-benefit analysis and for informing carbon pricing,”
Emmerling said. “Because CO2 stays in the atmosphere for centuries, each (metric) ton has long-lasting impacts on societies worldwide. Existing estimates already account for effects such as mortality, health, biodiversity loss, and economic damages, but until now they have largely overlooked the ocean.
Our work focuses on quantifying that missing ocean component, which matters because the ocean covers most of the planet and, although its links to society are often indirect, they are highly relevant and have significant economic and welfare consequences.”
According to a study, the ocean has been a major blind spot in calculating the social cost of carbon. (Courtesy: Shutterstock)
Why the ocean matters
The ocean covers more than 70 percent of the Earth’s surface and supports a wide range of economic and social benefits, from food supply and trade to coastal protection, health, and cultural value. Yet, its role has largely been absent from the climate-economy models that underpin carbon pricing and policy decisions.
The study brings together a rich literature of biophysical and economic studies into a single integrated framework, translating physical climate impacts into monetary welfare losses. This includes not only market impacts, such as reduced fisheries productivity or port disruptions, but also non-market values such as nutrition, health, biodiversity, and recreational values.
One of the most significant findings is that health impacts linked to fisheries account for nearly half of the ocean-related climate damages. In many countries, especially lower-income and island states, fish are a crucial source of protein and micronutrients. Climate-driven declines in fish stocks translate directly into higher mortality and poorer health outcomes — high-cost impacts that are rarely visible in traditional economic assessments.
Coral reefs emerge as another major driver of losses. Highly sensitive to temperature and ocean acidification, reefs provide ecosystem services worth hundreds of thousands — and in some cases millions — of dollars per hectare, from tourism and fisheries to coastal protection and biodiversity.
A stark reminder of the importance of climate policy
The study finds that ocean-related damages are unevenly distributed across regions. Countries with high dependence on marine ecosystems for food, tourism, and transport — including many lower-income countries and small island developing states — face disproportionately large welfare losses. In some economies, ocean damages account for 20 to 30 percent of total climate-related welfare losses, significantly amplifying existing inequalities.
By omitting ocean impacts, current estimates of the social cost of carbon — and therefore optimal carbon prices — are systematically too low. For comparison, carbon prices in major markets such as the EU currently hover around 70 to 80 euros per metric ton, well below the levels implied when ocean damages are included.
The findings suggest that fully accounting for ocean impacts could justify significantly higher carbon prices, strengthening the economic case for faster emissions reductions.
One of the main takeaways from the study is that it really is important to take into account all different aspects of climate change. (Courtesy: Shutterstock)
“What this study shows is that nature supports human well-being in fundamentally different ways, and a shifting climate threatens many of these contributions,” Granella said. “The ocean provides direct economic benefits like seafood and shipping, but it also sustains us through services that hardly appear in market transactions, such as coastal protection from mangroves, nutrients critical for human health, and the intrinsic value people place on knowing that marine ecosystems exist and that they will still be there for future generations. We need to recognize that all these contributions are highly valuable to human welfare. Losing a coral reef or a mangrove forest isn’t just an environmental loss, it’s a loss to human wellbeing that can’t be easily compensated for with money or manufactured alternatives.”
“One of the main takeaways from this study is that it really is important to take into account all different aspects of climate change,” Emmerling said. “It has effects on many things, a lot of which are still unrepresented — at least in economic modeling, and it can have a huge impact on societies and the economy. These damages are also highly unequal: Poorer and more vulnerable regions, particularly small island states, depend heavily on ocean ecosystems for livelihoods, food, and income. Damaging the oceans therefore risks deepening existing inequalities and increasing poverty.”
“The paper shows the importance of marine ecosystems for societal well-being and for the evaluation of the true cost of climate change damage,” said Tavoni, CMCC’s principal scientist and director of CMCC’s European Institute on Economics and the Environment. “The standard accounting of the socio-economic costs of climate change has ignored nature. In this and previous work published in Nature with the same collaborators, we have deepened our understanding of the fragility of ecosystems, and their consequences for humanity.”
The study was funded through the Scripps Institutional Postdoctoral Fellowship. Additional study authors include Octavio Aburto-Oropeza from Scripps Oceanography; Luke Brander from Leibniz University; William WL Cheung from the University of British Columbia; Chris M. Free from UC Santa Barbara; and Jasper Verschuur from the University of Oxford
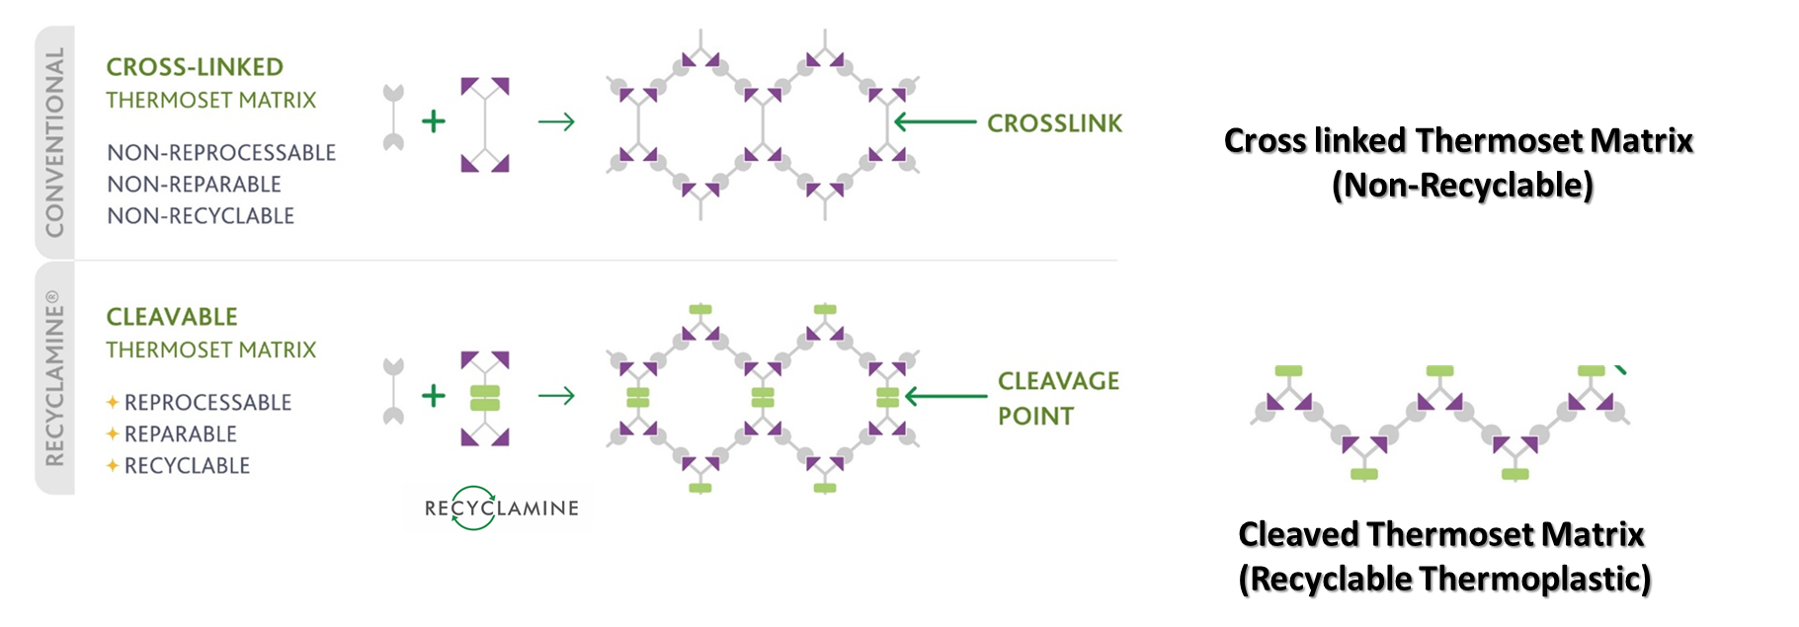
Recyclamine is often cited as a disruptive innovation in epoxy chemistry. From a technical standpoint, what makes it fundamentally different from conventional wind-blade epoxies?
Traditional wind-blade epoxies rely on permanent cross-linked networks formed using amine or anhydride hardeners. These networks deliver excellent fatigue and durability but are inherently irreversible. Recyclamine features an innovative curing agent design that incorporates specially engineered cleavable chemical linkages directly into the crosslinked network of the epoxy thermoset. Throughout the wind-turbine blade’s operational lifespan (typically 20 to 25 years), these linkages remain fully stable, delivering the same high performance, durability, and structural integrity as traditional non-recyclable thermoset resins. At the blade’s end-of-life, under controlled chemical conditions, the network can be selectively deconstructed. This enables true thermoset recyclability without sacrificing the exceptional mechanical properties required for demanding wind turbine blade applications. (See Figure 1)
Figure 1
Wind blades operate for 20 to 25 years under extreme cyclic loading. How does Recyclamine perform in terms of fatigue and long-term durability?
Fatigue resistance is non-negotiable in wind energy. Our Recyclamine-based epoxy systems have been extensively tested under representative tensile-tensile and flexural fatigue regimes used for blade qualification. Results consistently show stiffness retention above 90 percent after millions of cycles, matching or exceeding incumbent blade epoxy systems. Glass transition temperatures typically exceed 80 to 100°C, depending on formulation, ensuring thermal stability across diverse climatic conditions. Importantly, moisture uptake and hydrothermal aging behavior are comparable to conventional epoxies, which is critical for offshore and high-humidity environments.
Figure 2
How compatible is Recyclamine with existing wind-blade manufacturing processes, such as resin infusion?
Process compatibility was a key development objective. Recyclamine systems can be engineered to deliver low initial viscosity, long infusion windows, and controlled cure kinetics compatible with vacuum-assisted resin infusion and RTM (Resin Transfer Molding).
This allows blade manufacturers to integrate recyclable epoxies without capital investment or process redesign. Furthermore, the cure cycles and post-cure requirements closely mirror those of conventional non-recyclable epoxy systems currently used in high-volume blade production, which significantly lowers the barrier to adoption for large-scale blade production.
Can you elaborate on the recycling process itself and the quality of recovered materials?
Figure 3
At end-of-life, blades manufactured with Recyclamine-based epoxies can be treated using a proprietary chemical recycling process. The resin matrix is converted into a reusable thermoplastic-like material, while the reinforcing fibers are cleanly separated. Mechanical testing shows that recovered glass or carbon fibers retain up to 90 to 95 percent of their original tensile properties. This is a critical distinction from mechanical recycling, where fibers are typically downgraded.
The recovered resin from the Recyclamine recycling process emerges as a high-quality thermoplastic epoxy (no longer a crosslinked thermoset), which can be easily isolated, dried, and processed into versatile forms such as long polymer strands, pellets, or powder/fine granules. Such forms enable the resin to be repurposed in diverse downstream applications, e.g. an iPhone case — fully closing the loop in a genuine circular economy for epoxy-based composites. (See Figures 2, 3, and 4)
What impact can Recyclamine have on the environmental footprint of wind energy?
Lifecycle assessments indicate that epoxy resins account for a significant portion of a blade’s embodied carbon. By enabling high-value recycling and reducing landfill or incineration, Recyclamine can lower the overall lifecycle CO₂ footprint of wind blades by approximately 37 percent. Additionally, the ability to recover fibers reduces demand for energy-intensive virgin glass or carbon fiber production. As sustainability metrics increasingly influence turbine procurement decisions, this becomes a tangible competitive advantage. (See Figure 5)
Figure 4
How do you see OEMs and regulators responding to recyclable epoxy technologies in the coming decade?
We are already seeing strong interest from OEMs as landfill bans and extended producer responsibility regulations gain momentum, particularly in Europe. Over the next 10 to 15 years, recyclable thermosets are likely to move from pilot programs to qualification standards. Recyclamine provides a practical pathway for OEMs to meet future regulatory requirements without compromising blade performance, reliability, or cost competitiveness.
Figure 5
Finally, what is your long-term vision for Recyclamine in wind energy?
Our vision is for recyclable epoxies to become the default material choice for wind blades. As turbine fleets age and decommissioning volumes rise, circularity will be essential for maintaining the sustainability credentials of wind energy.
Recyclamine marks a fundamental paradigm shift in the wind-energy sector, moving away from managing composite end-of-life waste toward designing waste out entirely, enabling wind power to remain one of the most sustainable energy sources over its full lifecycle. Recyclamine Technology is truly the world’s first solution to end-of-life management for epoxy composites – a technology innovation of the Advanced Materials Business of Aditya Birla Chemicals, Aditya Birla Group.
The landscape of renewable energy is constantly evolving, with wind power standing as a testament to human ingenuity in harnessing nature’s forces. For more than three decades, towering turbines have dotted our horizons, silently converting the invisible currents of the air into clean electricity. These pioneering wind farms, many established in the late 1980s and 1990s, were revolutionary in their time, laying the groundwork for the massive global industry we see today. However, time marches on, and even the most robust machinery has a lifespan. As these first-generation wind installations approach, or in some cases exceed, their initial 20-25 years operational design life, a critical question arises: what becomes of these aging giants?
The answer, increasingly embraced by energy developers, policymakers, and environmental advocates alike, is repowering. Far from merely performing routine maintenance or patching up old equipment, repowering is a transformative process. It involves the strategic decommissioning of older, less efficient wind turbines and their replacement with state-of-the-art, larger, and significantly more powerful machines. This isn’t just an upgrade; it’s a complete revitalization, breathing new life into established sites and unlocking their full potential.
The rationale behind repowering is multifaceted, rooted deeply in both robust economic principles and an unwavering commitment to environmental stewardship. It represents a mature and intelligent approach to renewable energy asset management, recognizing that the most sustainable energy is often that which leverages existing infrastructure and proven locations.
The rationale behind repowering is multifaceted, rooted deeply in both robust economic principles and an unwavering commitment to environmental stewardship. (Courtesy: GreenSpur)
The Compelling ‘Why’: Economic and Environmental Imperatives
The decision to repower a wind farm is driven by a confluence of powerful factors:
Exponential increase in energy production: Technological advancements have been staggering. It’s common for a repowered project to generate two to five times the annual energy production (AEP) of the original farm, often using a fewer number of turbines.
Maximizing existing infrastructure: Repowering capitalizes on pre-existing infrastructure—land already zoned, environmental assessments conducted, and the crucial grid connection already in place. This dramatically reduces permitting risks and accelerates project timelines compared to “greenfield” development.
Reduced visual and acoustic impact: Because modern turbines are so much more powerful, fewer units are required for higher output, simplifying the visual profile. Improved aerodynamics also led to significantly lower noise levels.
Extending the lifespan: Repowering effectively grants a wind farm a second life, securing decades more of clean energy production from a proven location.
GreenSpur Wind’s primary innovation lies in its permanent magnet agnostic generators (PMGs). (Courtesy: GreenSpur)
Technological Evolution and the Repowering Blueprint
The transition is made possible by massive advancements in engineering, aerodynamics, and materials science. Today’s machines are fundamentally different from their predecessors.
The Technological Leap: From Turbines to Super-Turbines
Rated capacity vs. physical size: Older turbines might have been 0.5 MW to 1 MW; repowering involves 3 MW to 6 MW machines, with rotor diameters often surpassing 150 meters. The power output is proportional to the swept area, which is exponentially larger on new machines.
Aerodynamic blades and materials: Modern turbine blades are complex aerodynamic designs, using lighter, stronger composite materials to maximize efficiency across various wind speeds.
Smart control systems: Sophisticated pitch and yaw control systems constantly adjust the blade angles and nacelle orientation based on Lidar and anemometer data. This ensures the turbine operates at its optimal efficiency curve, leading to a much higher capacity factor.
Drivetrain efficiency: Advances include improved gearboxes for mid-speed geared and the increasing adoption of direct-drive systems, which eliminate the gearbox for better reliability and lower maintenance.
GreenSpur’s Axial-Flux PMG design is modular and lighter than traditional radial-flux machines. (Courtesy: GreenSpur)
The Repowering Process: A Step-by-Step Blueprint
Repowering is a complex, multi-phase engineering project:
Assessment and feasibility: Analyze historical wind data, conduct new micro-siting for larger turbines, and review the existing grid capacity to determine if a substation upgrade is required.
Decommissioning and logistics: Old turbines are disassembled. Steel and copper are recycled. The large composite turbine blades are the most challenging component, requiring specialized waste management or novel recycling techniques. New, larger reinforced concrete foundations are poured to support the massive new loads.
Construction and installation: New access roads are upgraded. Specialized crawler cranes lift and install the new, heavier tower sections, nacelles, and rotor blades.
Commissioning and testing: The turbines are synchronized with the grid and undergo rigorous performance testing before becoming fully operational.
Challenges, Sustainability, and the Role of GreenSpur
The repowering trend must overcome logistical and sustainability hurdles, a goal increasingly facilitated by technological innovators like GreenSpur Wind.
The Roadblocks: Logistical and regulatory challenges
Regulatory friction: Despite site pre-approval, the drastic change in turbine size can trigger new, lengthy planning reviews, especially concerning height and visual impact.
Grid Constraint: The exponential power increase often mandates costly and time-consuming transmission line and substation upgrades.
Table 1
The Sustainability imperative: The blade challenge
The disposal of composite turbine blades presents the biggest obstacle to a circular economy for wind energy. These fiberglass and carbon-fiber blades are incredibly durable, making them difficult to recycle efficiently. (See Table 1)
The GreenSpur Advantage in Repowering
GreenSpur Wind’s primary innovation lies in its permanent magnet agnostic generators (PMGs). This technology plays a key role in the long-term viability of repowering:
Lighter generator construction: GreenSpur’s Axial-Flux PMG design is modular and lighter than traditional radial-flux machines. This weight reduction eases the structural demands on the new tower and foundation, potentially simplifying upgrades and lowering CapEx for installation.
Supply chain de-risking: By using alternative materials such as Dysprosium-free Neodymium magnets, or gap magnets and aluminum instead of Dysprosium-rich rare earth elements (REEs) such as N48SH, N45UH, and copper, GreenSpur insulates repowered projects from the volatile pricing and geopolitical risks associated with REE supply chains, guaranteeing stability over the asset’s 25-year life.
Enhanced reliability: The design eliminates complex, high-maintenance systems, such as the liquid cooling required for many conventional PMGs, opting for simpler, air-cooled architecture. This leads to lower Operational Expenditure (OpEx) and higher uptime.
Financial Case and Global Outlook
The decision to repower hinges on a single metric: the levelized cost of energy (LCoE). GreenSpur’s technological contributions translate directly into measurable cost savings, making the repowering investment far more attractive.
Quantifying the Savings: The GreenSpur LCoE Impact
GreenSpur’s rare earth-free technology is designed to deliver significant savings across both the capital expenditure (CapEx) and operating expenditure (OpEx) as seen in Table 2.
Table 2
These substantial LCoE savings accelerate the financial payback period for repowering projects, securing investor confidence in replacing old assets with advanced turbines.
Global Outlook: A Crucial Driver for Net Zero
Repowering is now recognized as a critical global strategy, particularly in mature wind markets such as the United States and Germany, which have large fleets of aging turbines.
By maximizing the potential of existing sites, repowering serves as the most efficient way to achieve rapid, dense increases in renewable energy output without new land acquisition. It is an intelligent optimization of green assets that will:
Accelerate decarbonization: Providing a fast track to integrating more clean power into existing grids.
Ensure energy security: Guaranteeing reliable clean energy generation for another three decades.
Drive innovation: Creating market demand for sustainable component technologies such as GreenSpur’s PMGs and novel blade recycling processes.
Repowering is more than just an industry trend; it is a foundational strategy for energy maturity. By combining strategic site renewal with sustainable technological innovation, the world ensures that its first generation of wind farms not only survives but thrives, providing the crucial second wind that will power the next phase of the Net Zero transition.
Wind turbine gearbox often fail to reach their expected lifetime of 20 years. This causes great maintenance costs and unexpected downtime. Similarly, gearboxes that do reach their expected lifetime are often replaced while they might be able to stay in operation for longer, missing out on revenue. There is a need for a reliability estimation based on the operating conditions such that premature failure and extended lifetime risks can be assessed. This work proposes a method to dynamically compute the gearbox’s reliability based on real-time measurements of the operating conditions.
This is done by introducing the concept of “used capacity,” which denotes the accumulated damage on the gearbox during operation. It generalizes the traditional Weibull model by allowing for varying operating conditions that cause damage to accumulate similar to Miner’s rule. This results in a more accurate reliability estimate than commonly used static estimates. Furthermore, other key performance indicators such as the mission risk and the remaining useable life can be derived from the model.
The approach was tested using synthetic data for a Siemens Gamesa G97 2MW Turbine as part of a research project together with National Renewable Energy Laboratory (NREL) and Siemens Gamesa. Furthermore, the approach was applied to real wind-turbine data from a Penmanshiel wind park. The results demonstrate realistic reliability indicators for the gearbox and its components. Using this result, one can improve maintenance strategies, optimize resource allocation, and assess risk more accurately. Moreover, the approach is adaptable to other types of rotating machinery, offering broad applications beyond wind turbines.
1 Introduction
Wind energy has become an important component in the global transition to sustainable energy. As wind turbines are increasing in size and capacity, it is becoming more important to ensure the reliability of critical components as failures and downtime become more expensive. From all components in a wind turbine, the gearbox has been shown to be the component that experiences the greatest number of failures [1]. Wind-turbine gearboxes frequently fall short of their expected 20-year lifespan and few make it past the 10-year mark [2, 3]. Wind-turbine gearbox failures are one of the main reasons for significant increase in operation and maintenance (O&M) costs and wind turbine downtime
While there is a wide variety in failure prognostic models, reliability assessments are commonly performed using the L10 life formula and the Weibull distribution due to their simplicity and ease of use [4]. The reliability calculation is done using expected average operating conditions such as torque and rotational speed. Based on the expected operating conditions and the time of operation, a reliability estimate can be calculated. However, once a wind turbine is in operation, the operating conditions naturally vary due to wind conditions, grid interaction, and environmental factors. This can lead to deviations from the initial assumed reliability distribution, resulting in an unreliable reliability estimate.
This article proposes a novel dynamic reliability assessment by integrating real-time operational data in a stochastic model. This model introduces a ‘used capacity’ metric, extending Weibull-based reliability estimation to account for variable operating conditions. By keeping track of the used capacity, an accurate estimate of the reliability can be calculated. Based on the used capacity formulation, additional key performance indicators can be calculated, such as the mission risk and the remaining useful life. The proposed method is applied to real operational data of wind turbines to compare it to traditional methods and to show the application to a wind park. This work aims to provide improved reliability metrics that can be used for predictive maintenance and lifecycle management and ultimately reduce O&M costs for wind turbine operators.
2 Background
In this section, we recall the common reliability calculation methods; the L10 formula, the Weibull distribution and Miner’s rule.
2.1 L10 formula
The basic rating life, L10, is the millions of revolutions that the bearing can be expected to endure with 90 percent probability, where failure is defined as the appearance of subsurface material fatigue as per ISO 15243 [5]. In the case of gears, tooth pitting and bending fatigue are considered as per ISO 6336 [6]. The basic rating life, from Lundberg and Palmgren in 1924 as cited by [7], is given by Equation 1:
Equation 1
with Cp the dynamic load capacity, F the load and p the life exponent. The parameters Cp and p are often known from literature (i.e. given by bearing or gear manufacturers) or can be determined analytically or experimentally. The L10 formula is an initial estimate for the expected life but cannot provide an adapted estimate during operating.
2.2 Weibull distribution
More generally, it has been found that fatigue life follows a Weibull distribution, as first developed by Weibull in 1939 [7]. Which can be written using L10 in Equation 2:
Equation 2
where S denotes the survival probability. Substituting S = 0.9 for L10 allows us to solve for A and rewrite the Weibull equation (Equation 3):
Equation 3
The Weibull distribution gives more insight in the failures we expect over the course of an operation. However, the Weibull distribution is only dependent on the number of revolutions and is defined for a fixed load. Varying operating conditions cannot be incorporated in this formulation.
2.3 Miner’s rule
Miner’s rule is a simple method to incorporate varying operating conditions and calculate the accumulated damage. If Li is the number of revolutions under load Fi and Li is the L10 at load Fi, then the total damage under n stress levels is seen in Equation 4:
Equation 4
According to Miner’s rule, failure occurs when the total accumulated damage D is equal to or exceeds 1. This is clearly a conservative estimate, since only 10% is expected to fail at that point, but large margins are common in engineering design to guarantee successful operation. While Miner’s rule has been successful in engineering practice, it has been advised to be extended using probabilistic approaches [8, 9].
2.4 Gearbox modelling
The previous reliability models are suited to model a single component. In order to model the reliability of a gearbox as a whole, the components can be modeled separately and combined to derive reliability model for a gearbox [10, 11]. It is common to consider the reliability of the system, i.e. the gearbox, as the product of the reliabilities of the components. However, the reliabilities of the components can also be modeled as being dependent based on the mechanics of the gearbox [12].
Another approach to estimate the remaining useful life of planetary gearboxes is to use a state space model based on the Gamma process [13].
2.5 Conclusion
While these models provide useful reliability estimates, they assume static operating conditions or a deterministic failure threshold. In reality, wind-turbine gearboxes experience fluctuating loads and failure is a stochastic occurrence. The following section introduces a probabilistic approach that adapts reliability estimation to real-time operating data.
3 Methodology
This section proposes the reliability calculation based on the used capacity variable. First, the used capacity and reliability calculation is done for a single gearbox component; a bearing. Then, the used capacity notion is extended to a gearbox, being a system of certain components. Lastly, the additional prognostic metrics mission risk and remaining useful life are defined.
3.1 Used capacity metric
In order to incorporate varying operating conditions, we define a new random variable, which we call the capacity and is denoted by C. The capacity combines the operating conditions load and speed in a single variable, similarly to Miner’s rule. We define capacity C in Equation 5:
Equation 5
meaning that the bearing can last L revolutions under operating condition A. To incorporate varying operating conditions, we let capacity increment in Equation 6:
Equation 6
as illustrated in Figure 1. Here, the simplifying assumption from Miner’s rule that the order of applied loads has no effect is used.
Figure 1. Used capacity accumulation.
3.2 Reliability
The way that the used capacity accumulates is similar to Miner’s rule. However, we treat the capacity C as a random variable. The Weibull distribution from Equation 2 can be written in terms of capacity in Equation 7:
Equation 7
and the reliability of the bearing can be determined based on the used capacity. Important is that the distribution now only depends on the capacity C and not on A and l separately. This allows us to incorporate varying operating conditions.
3.3. Gearbox as a system of components
In the previous sections, we took the example of a single bearing. Now we will generalize to a system of components. For example, a wind-turbine gearbox containing various bearings and gears. Suppose we have n components that define a system such that if 1 of the components fails this implies that also the system fails. In this case the reliability of the system is calculated in Equation 8:
Equation 8
Now the used capacity of the system Cs can be computed in Equation 9:
Equation 9
As such, we can define the used capacity of a wind-turbine gearbox and thus calculate its reliability.
3.4 Additional prognostics
The reliability follows directly from the Weibull distribution, but additional metrics can be computed. If the gearbox has been in operation and has exhibited a certain used capacity, then the remaining capacity has a conditional (left truncated) Weibull probability. Formally, the probability of remaining capacity c’ with confidence level α after having accounted for evidenced used capacity č is described as follows in Equation 10.
Equation 10
This implies that only knowledge of the used capacity č alters the likelihood of the remaining capacity c’. Two interesting metrics can be formulated: the mission risk and the remaining useful life, both of which can be determined based on purely the used capacity.
3.4.1 Mission risk
Given some used capacity č and a mission that requires future capacity c’, what is the probability α that the bearing can exhibit c’ more capacity? We can fix for some capacity c’ (the mission) and solve for the probability α. This gives an estimate for the risk of keeping a wind turbine in operation for a certain mission duration.
3.4.2 Remaining useful life
Given some used capacity č and confidence level α. How much capacity c’ can the wind turbine exhibit with confidence α? We can fix a confidence level α and solve for remaining useful capacity c’. The most interesting case is the remaining life with 90 percent reliability conditioned on the fact that the bearing has already exhibited a certain capacity. Since L10 is often denoted as the useful life of new components, the conditional L10 determines the remaining useful life of used components.
Both Remaining Useful Life (RUL) and Mission Risk statements depend on the known used capacity to date and require a prediction into the future, i.e. the capacity needed for the mission or the future operating conditions to estimate RUL in terms of revolutions instead of capacity. The prediction can be based on the expected operating conditions, but can also be done using exhibited used capacity from the past. As such, only the used capacity and its history is necessary to determine all metrics.
Figure 2: Penmanshiel wind-turbine locations on Google Earth [16].
4 Data and case study
Two different datasets, consisting of torque and speed measurements on the wind-turbine rotor, were used to illustrate the proposed method. First, a dataset for a single wind turbine over 20 years was used to compare the proposed method with traditional methods. Second, real measurement data from wind turbines from a 4.5-year-old wind park was used to illustrate its application to a wind park.
4.1. Single gearbox: Synthetic NREL data
A dataset over the course of a wind turbine’s typical design life, e.g. 20 years, is appropriate to compare the proposed method with traditional methods. Due to the lack of available data over such a period, a synthetic time series of torque and speed was created based on binned operating conditions. The binned operating conditions were derived from real-time measurements of the operating condition on a Siemens Gamesa G97 2MW turbine as part of a research project together with National Renewable Energy Laboratory (NREL) and Siemens Gamesa, of which these results are a continuation [14]. While the synthetic time series are similar to the binned data, the synthetic data had slightly higher operating conditions.
4.2. Wind park: real-world Penmanshiel data
A dataset of multiple wind turbines is needed to illustrate the different reliability estimates among wind turbines in a wind park as a result of the different operating conditions that they experience. This creates insights that can be used on a wind park management level. As such, the method is applied to open SCADA data of 14 Senvion MM82 2.05 MW wind turbines over 4.5 years from Penmanshiel [15]. Figure 2 shows the relative location of the wind turbines.
5 Results
We present the results for a single gearbox to compare the proposed method with traditional methods and the results for real-world data of a wind park.
Figure 3: The remaining useful life L10 according to Miner’s rule and the conditional L10 from the proposed method based on synthetic data of a wind-turbine gearbox. It shows that a gearbox may have remaining useful life after surviving the initial L10.
5.1 Single gearbox
Figure 3 shows the difference between the traditional L10, Miner’s rule and the proposed conditional L10. Since L10 is only based on expected operating conditions and not on measurements, it does not change over time. Miner’s rule states that failure can be expected after L10 is reached. The proposed method is able to calculate the remaining useful life, the life with over 90% conditioned on the accumulated used capacity. It can be seen that, if the gearbox has survived the initial L10, it may still have significant remaining useful life, depending on the accumulated used capacity. This demonstrates the proposed method in providing a more accurate estimation of remaining useful life beyond the initial reliability expectations.
Figure 4 shows the Weibull reliability estimates based on expected operating conditions and based on the synthetic operating conditions for a single gearbox. It can be seen that the reliability estimate based on expected operating conditions perfectly crosses the L10 line at 90 percent reliability, as the L10 is also determined based on expected operating conditions. The proposed method incorporates the experienced operating conditions, and it can be seen that the estimates decrease faster or slower based on these experienced operating conditions. Furthermore, it can be seen that reliability estimate based on the used capacity decreases faster than the initial Weibull estimate, because the synthetic operating conditions were higher than the expected operating conditions.
Figure 4: Weibull reliability estimation using the expected operating conditions and the used capacity baed on synthetic data of a wind turbine gearbox. It shows that the reliability estimate based on used capacity takes into account the higher experienced operating conditions.
5.2 Wind park
Figure 5 illustrates the reliability trends across the gearboxes of the 14 turbines in the Penmanshiel wind park. It can be seen that similar patterns are visible for all turbines, which is what one would expect since the turbines are experiencing similar wind conditions. However, the reliabilities start to diverge over time. Comparing this to the location of the turbines in Figure 2, it is clear that the turbines at the edge of the wind park are experiencing higher operating conditions, as they are more exposed to wind inflow. In contrast, the turbines in the centre are catching reduced wind, leading to lower operating conditions and thus slower decrease in reliability.
Figure 5: Reliability over time for wind turbines in Penmanshiel wind park, showing how edge turbines degrade faster due to higher loads.
Figure 6 shows the generated energy and the failure probability (1 — reliability) of the turbines after 4.5 years. As expected, it can be seen that the turbines that have generated more energy have lower reliability due to increased accumulated stress on the gearboxes. The relationship between energy production and reliability follows an exponential trend, and it can be seen that turbines with lower cumulative energy output exhibit disproportionately higher reliability. This is a direct consequence of the life exponent in the L10 formula.
These variations in reliability suggest that a wind park operator can optimize the distribution of reliability across the fleet by strategically managing turbine exposure to wind.
For instance, reducing the workload on turbines with higher accumulated used capacity while allowing other turbines to operate under increased loads can help balance failure risk and maximize overall uptime and energy production.
Figure 6: The generated energy and the reliability of the Penmanshiel wind turbines. It shows that turbines with lower generated energy have a larger reliability.
6 Discussion
This method forms the basis for a new reliability estimate, but some assumptions and limitations should be mentioned. First, this method estimates wind-turbine gearbox reliability based on fatigue failure due to wear on the material. Bearing failure is defined as subsurface fatigue appearance, and gear failure is defined by root pitting or bending fatigue, as per ISO standards [6, 5]. It does not account for early failures or other failure modes such as misalignment, lubrication issues, or material defects.
Also, failure of one component is considered as failure of the whole gearbox and therefore operation with a partially faulty gearbox is not considered. Faulty components would increase the stress on other components and the gearbox as a whole, which complicates a reliability model, but inspiration can be taken from [12]. Second, the reliability estimate relies on measured torque and speed data, making the accuracy dependent on data quality.
Uncertainty in measurements induces uncertainty in the reliability estimate. This uncertainty could be modeled, but it is advised to ensure accurate measurement data. Lastly, it should also be noted the current approach only considers torque on the gearbox carrier, capturing torque-induced loads but ignoring non-torque loads, i.e. disturbance forces, that also contribute to fatigue. Future work should incorporate these additional forces acting on the gearbox, if measurable.
7 Conclusion
This study presents a novel method to improve the reliability estimation of wind-turbine gearboxes by using real-time measurements of the operating conditions. By introducing the concept of “used capacity,” the proposed approach generalizes traditional Weibull distribution models, making them adaptable to varying conditions that a gearbox experiences over time.
This method provides accurate predictions of key performance indicators such as reliability, mission risk and remaining useful life. This can be the basis for better maintenance strategies and extended operational lifetimes for wind turbines. The application of synthetic data demonstrates the method’s effectiveness, laying a foundation for future implementation in real-world scenarios. Future work could extend this approach to other rotating machinery applications, such as offshore turbine drivetrains.
2017 Rolling bearings — damage and failures — terms, characteristics and causes Standard International Organization for Standardization Geneva, CH
2019 Calculation of load capacity of spur and helical gears Standard International Organization for Standardization Geneva, CH
Zaretsky E V 2016 Rolling Bearing Life Prediction, Theory, and Application Tech. rep.
Saunders S C 1970 A Review of Miner’s Rule and Subsequent Generalizations for Calculating Expected Fatigue Life: Tech. rep. Defense Technical Information Center Fort Belvoir, VA URL http://www.dtic.m il/docs/citations/AD0717283
Saunders S 1974 The Theory Relating the Woehler Equation to Cumulative Damage in the Distribution Fatigue Life Tech. rep. National Technical Information Service Washington State University
Savage M 1982 RELIABILITY MODEL FOR PLANETARY GEAR TRAINS Tech. rep.
Dinner H 2021 How Reliable is a Reliability Calculation? Tech. rep.
Renewables specialist FairWind announced a change in leadership for its Southern Europe and South America (SESA) region that took effect Jan. 1, 2026. Since acquiring regional onshore wind installation leader, Wind1000, in 2024, FairWind’s SESA business has been led by Wind1000 co-founders Jesús Garcia Mallo, Diego Garrido Cousillas, and Carlos Louzao Aris.
With the integration of Wind1000 into FairWind successfully completed, the three co-founders will move into a consultancy role with the business. The Southern European countries, and South Africa, will form the new Mediterranean region, which will be led by Aitor Diaz de Lezana Fernández.
FairWind’s current North America region will now incorporate the South American countries to become the Americas region. North America Regional Director Armando Barradas will continue leading the newly expanded region.
Fernández joined FairWind in September 2024 as Regional Head of Service for SESA, having previously held senior service leadership roles at Siemens Gamesa and Nordex in Latin America.
Barrados joined FairWind in 2023. His previous experience includes leading Siemens Gamesa’s Latin American business. “These changes will allow the Mediterranean business to focus on growth in the Southern European countries, while enabling efficiencies in shared resources across the Americas region,” said Stewart Mitchell, FairWind CEO. “Expanding our service provision to support customers with the safety and reliability of their assets will be a key focus for both Aitor and Armando as they deliver our ambitious growth plans for their respective regions.The acquisition of Wind1000 was central to our growth strategy in the region and I would like to thank Jesús, Diego, and Carlos for the significant contribution they’ve made to making this a success and for their continued support as they move into their new roles.”
The global wind energy market is entering its strongest growth phase to date, driven by accelerating national decarbonization targets, energy security needs and long term industrial strategies. The aggregate installations are expected to reach 934.6 GW in 2030, forecasts GlobalData, a leading intelligence and productivity platform.
GlobalData’s latest report, “Wind Turbines Market Size, Share and Trends Analysis by Technology, Installed Capacity, Generation, Key Players and Forecast, 2024-2030,” reveals global annual wind turbine installations totaled 115.3 GW in 2024. Onshore wind accounted for 91.8 percent of installations, with offshore wind representing the remaining 8.2 percent.
GlobalData’s report reveals that global annual wind turbine installations totaled 115.3 GW in 2024. Onshore wind accounted for 91.8 percent of installations, with offshore wind representing the remaining 8.2 percent. (Courtesy: GlobalData)
“The Asia-Pacific (APAC) region leads the global wind turbine market, accounting for the largest share of annual installations and possessing the most advanced manufacturing capabilities for turbines, components, and offshore technologies,” said Bhavana Sri Pullagura, GlobalData’s senior power analyst.
APAC’s dominance is primarily driven by China’s extensive onshore and offshore development, India’s rapidly growing domestic manufacturing and auction-driven expansion, and the emerging offshore projects in Japan and Australia, Pullagura said.
Europe, the Middle East, and Africa (EMEA) represent the second-largest market. Europe serves as the regional anchor, bolstered by binding climate mandates under the EU Green Deal, the revised Renewable Energy Directive III, and a strong offshore wind trajectory led by countries in the North Sea.
The Middle East and North Africa are advancing utility-scale renewable energy projects through government-backed procurements and decarbonization initiatives, while certain areas of Sub-Saharan Africa are gradually unlocking wind projects with the help of international financing and regional power pool initiatives.
The Americas ranks as the third-largest market, with the U.S. leading the way, where the Inflation Reduction Act (IRA) has stimulated clean energy manufacturing, repowering activities, and the development of an emerging offshore wind supply chain.
The global wind turbine market is on the brink of a new era of accelerated growth, fueled by increasing clean-energy commitments, rapid technological advancements, and more resilient manufacturing ecosystems.
“With Chinese OEMs leading global capacity additions and Western manufacturers driving innovation in offshore and digital turbine platforms, the industry is entering its most competitive and transformative phase to date,” Pullagura said. “As nations ramp up wind deployment to meet climate targets and ensure long-term energy independence, the global wind-turbine market is expected to grow significantly, reinforcing wind power’s role as a cornerstone of the world’s renewable energy future.”
The Scottish National Investment Bank has invested 20 million pounds in Renewco Power, a Glasgow-headquartered renewable energy developer, via a fund managed by Corran Capital, a specialist private equity firm focused on clean energy and the environment. The Bank joins existing investor, SSE plc, which has committed an additional 9 million pounds as part of the round.
This latest investment will be used to advance Renewco’s wind and solar projects throughout Scotland and the U.K. while further accelerating the transition to clean energy across its key European markets.
A recent investment will be used to advance Renewco’s wind and solar projects throughout Scotland and the U.K. (Courtesy: Renewco)
Established in 2021 by a team of highly experienced and entrepreneurial renewables and finance executives, Renewco has developed a diversified pipeline of more than 7 GW across solar, onshore wind, battery storage, and green hydrogen projects. The business employs 38 people at its offices in Glasgow, Edinburgh, London, Madrid and Milan, with Scotland being home to the largest renewables development team in the business.
“This investment is a strong endorsement of the team and quality of our project pipeline that we have assembled over the last five years,” said Gavin McCallum, Renewco CEO. “We are proud to be a Scotland headquartered business, and the Bank is a natural fit to support us on our growth journey. This investment allows us to remain at the forefront of renewable energy in Scotland and significantly contribute to the country’s net zero ambitions.”
The Bank is Scotland’s development bank and an impact investor. Its investments support Scottish businesses and projects with the aim of delivering both commercial returns and societal benefits. “The strength of Renewco’s Scottish project pipeline reflects the wealth of opportunity and potential in our renewable energy industry,” said Ross Dobbie, the bank’s investment director. “The Bank’s investment will help to unlock this potential and accelerate the development of new capacity across Scotland.”
“Renewco is an impressive home-grown Scottish business success story which we have been proud to back from Day 1,” said Gary Le Sueur, Corran Capital partner.