


The friction torque of rotor blade bearings is a required parameter for the design of pitch actuators and may provide information about continued degradation and impending failure of the bearing. The torque is heavily influenced by the operating conditions and external loads acting on the bearing. Test results for real-size bearings under realistic loads are rare.
This article presents test results of various double-row four-point bearings of three different diameters, ranging from 0.7 meters up to 5 meters. They are loaded with bending moments and axial loads, and their behavior at different speeds is compared. For the same bearing type, large differences are observed at zero load that decrease for higher loads. At lower contact pressures, the change from four-point into two-point contact is clearly visible and results in a temporary decrease of the torque. To monitor potential degradation of the bearing, an empirical model that can be fit to a particular bearing is proposed.

1 Introduction
Rotor blade bearings rotate (“pitch”) the blades of modern wind turbines along their longitudinal axis. This allows for braking of the turbine and is therefore a safety-critical function. Aside from the large movements required for braking, blades also pitch by small angles in order to control the power of the turbine, and manufacturers are increasingly utilizing this to reduce fatigue loads on the other components [1]. Pitch movement is commonly facilitated with an electrical pitch drive or a hydraulic one. The friction torque of the bearing is a required parameter for the design of these actuators. As it is significantly influenced by the loads acting on the bearing, a friction torque model is needed to gauge the torque of the bearing in operation when the actuator design is carried out.
The friction torque is a resistance that acts against the direction of rotation. It is caused by friction of the rolling bodies with the raceway and, to a lesser extent, with the cage, as well as the friction of the seal. Rolling body to raceway friction is the greatest component of the friction torque, and it is therefore highly dependent on the load distribution within the bearing [2]. Bearings can experience a number of different damage modes. These include, but are not limited to, rolling contact fatigue of the raceways, wear of the raceways, destroyed rolling elements, and cage failure [3][4]. All of the aforementioned can affect the load distribution or change the friction torque in another manner, e.g., by increasing raceway roughness or producing debris in the bearing. Therefore, a large number of damage mechanisms can be detected externally by monitoring the friction torque of the bearing. A change of this characteristic under comparable conditions indicates damage in the bearing. Rotor blade bearings, however, experience stochastic operating conditions.
Comparable load situations may thus be difficult to find, hence why a friction torque model can be of great help to gauge whether the bearing’s behavior has altered. There are a number of friction torque models to be found in the literature. An overview of relevant empirical models is given in [5], who apply the results to a blade bearing subjected to a bending moment and compare the various models with test results. Another measurement of blade bearing friction torque is given in [6], where a blade bearing is placed on a test rig and subjected to a combination of bending moment, radial force, and axial force. The measured friction torque is then compared to an empirical model. Both publications suggest the models do not necessarily reflect the torque of rotor blade bearings accurately.
The two aforementioned publications are the only publications with measurements of blade bearing friction torque known to the authors. Other friction torque models can be found e.g. in [2] [7], where the authors construct a detailed contact model of bearings and predict bearing torque based on simulated contact stresses.
Friction torque measurements of large slewing bearings are expensive and elaborate procedures, particularly for measurements under realistic loads. Real-size blade bearings are large and test rigs that can apply loads in all degrees of freedom are rare. This article aims to supplement the existing literature with many additional measurements under various loads shown in Section 4 using the test setups shown in Section 2. We then propose a friction torque model that can be fit to individual bearings in Section 5, before finishing the article with conclusions in Section 6.
2 Test Setup
The results presented in this article consist of test results collected over the span of several years. The measurements were taken in the context of various test campaigns. They contain results for bearings of three different sizes, tested on four different test rigs. Bearings of each size were subjected to both axial loads and bending moments.
All bearings investigated in this article are double-row, four-point bearings. This is currently the most common type of blade bearing [8]. All of the bearings tested are made of 42CrMo4 steel with balls made of 100Cr6 steel, which is a typical combination for blade bearings [9]. The bearings were made by three different manufacturers who commonly supply bearings to actual wind turbines, and they all use the same commercial grease specifically recommended for blade bearings.
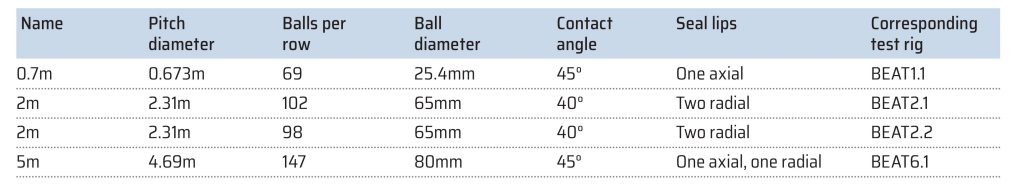
The three bearing sizes used for this article are listed in Table 1. The smallest ones are referred to as “0.7-meter bearings” in the following. They are used for more fundamental tests and are much smaller than the blade bearings used in modern, multi-MW turbines. Nonetheless, the 0.7-meter bearings were manufactured using the same techniques also used for larger bearings, and their design was made to resemble actual blade bearings as closely as possible. Next in line are the “2-meter bearings.” These bearings were made for existing 3 MW onshore turbines. Two slightly different versions of this bearing were tested, with one having four more balls than the other but otherwise being of identical dimensions.
This is because the two slightly different versions were built by two different manufacturers. Finally, the “5-meter bearings” are bearings created for the theoretical IWT7.5 reference turbine, a 7.5 MW nearshore turbine [1]; they are described in more detail in [10]. All bearings use different seals, with the smallest bearings having only one dust lip for the upper and lower seal while the other two bearings have two lips per seal.
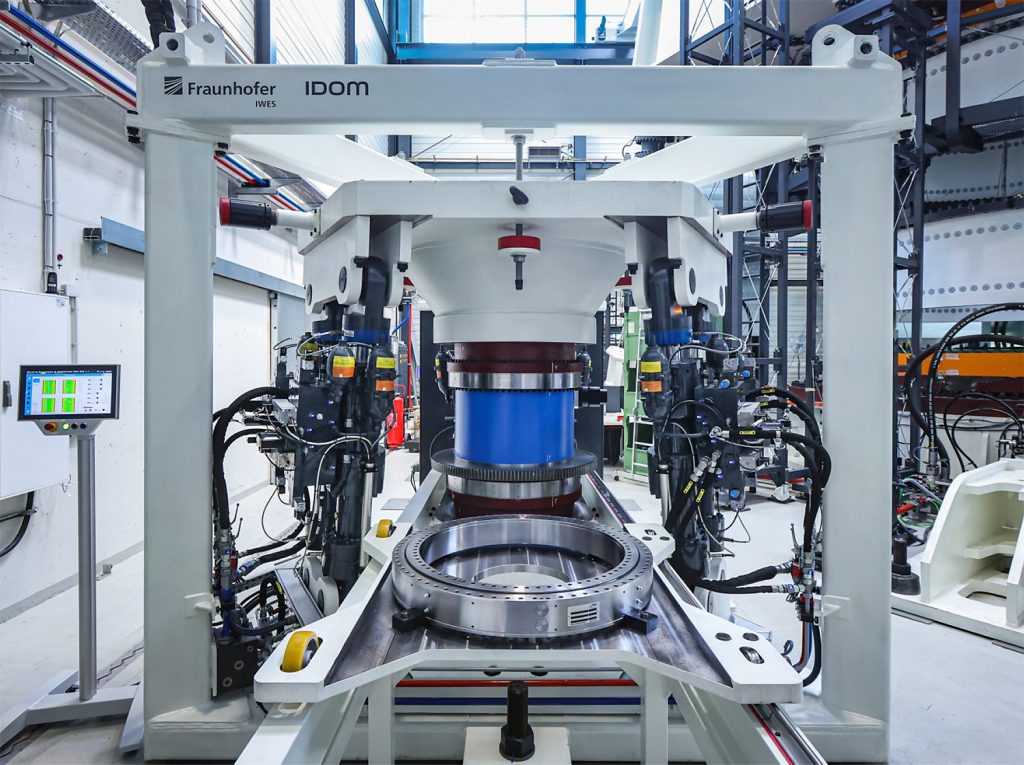
Four different test rigs were used for the generation of the results in Section 4. The test rigs are shown in Figure 1. Two test rigs are hexapod designs that can apply loads in six degrees of freedom (DOF), while the other two are less complex in their design. The smallest of the test rigs is called “Bearing Endurance and Acceptance Test rig 1.1” (“BEAT1.1”) and is shown in Figure 1a. It was used to generate test results for the 0.7-meter bearings. It is a hexapod design and can thus apply loads in six DOF, but is particularly suited to the application of high bending moments due to the orientation of the cylinders. This allows for an application of loads that closely resemble those on an actual blade bearing in a wind turbine.
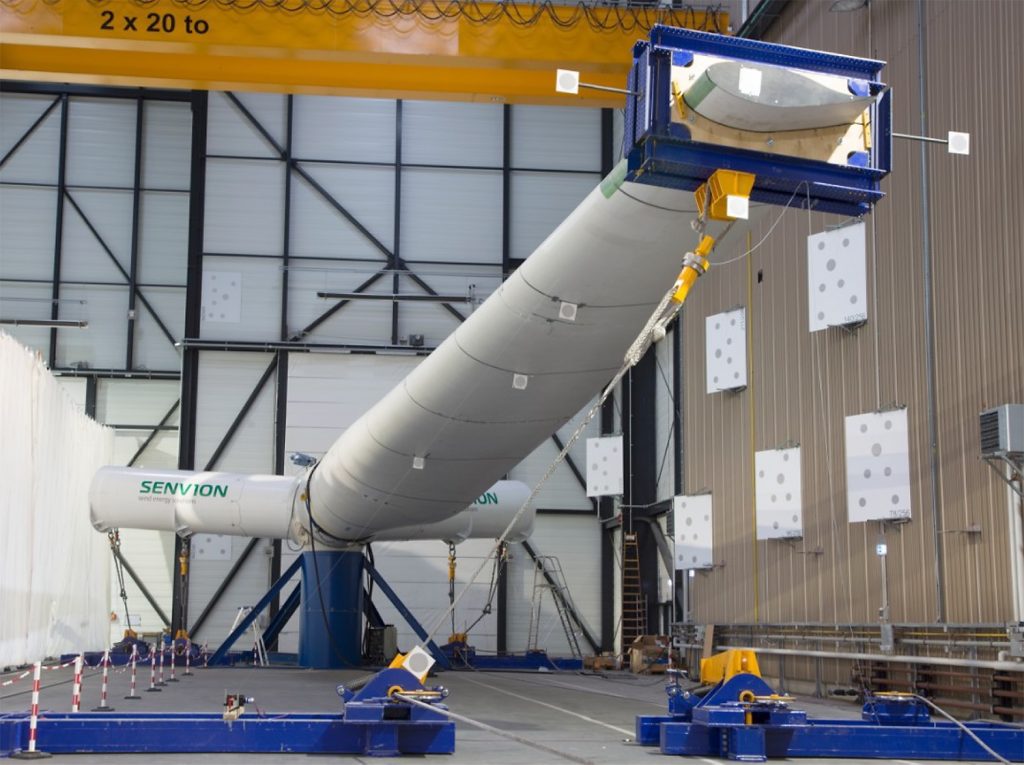
Bearings are installed in the center of the hexapod, connecting the bottom of the structure with the upper, actuated platform. Due to the closed-chain design of the hexapod, two bearings are required in order to rotate the blue-colored central element shown in Figure 1a. An electrical drive is used to turn the bearings. There are two test rigs shown for the 2-meter bearings. These are only able to load the bearings accurately in fewer DOF. The first of these is called “BEAT2.1”; it is shown in Figure 1b. It is the only open-chain test rig design included in this article and, consequently, the only one that merely uses one bearing for a test. The test rig consists of an actual hub of the wind turbine for which this bearing was used, and a significant part of its blade. Rotation of the bearing is achieved using an electrical drive. By applying a load to the blade, it is possible to apply a bending moment to the bearing.
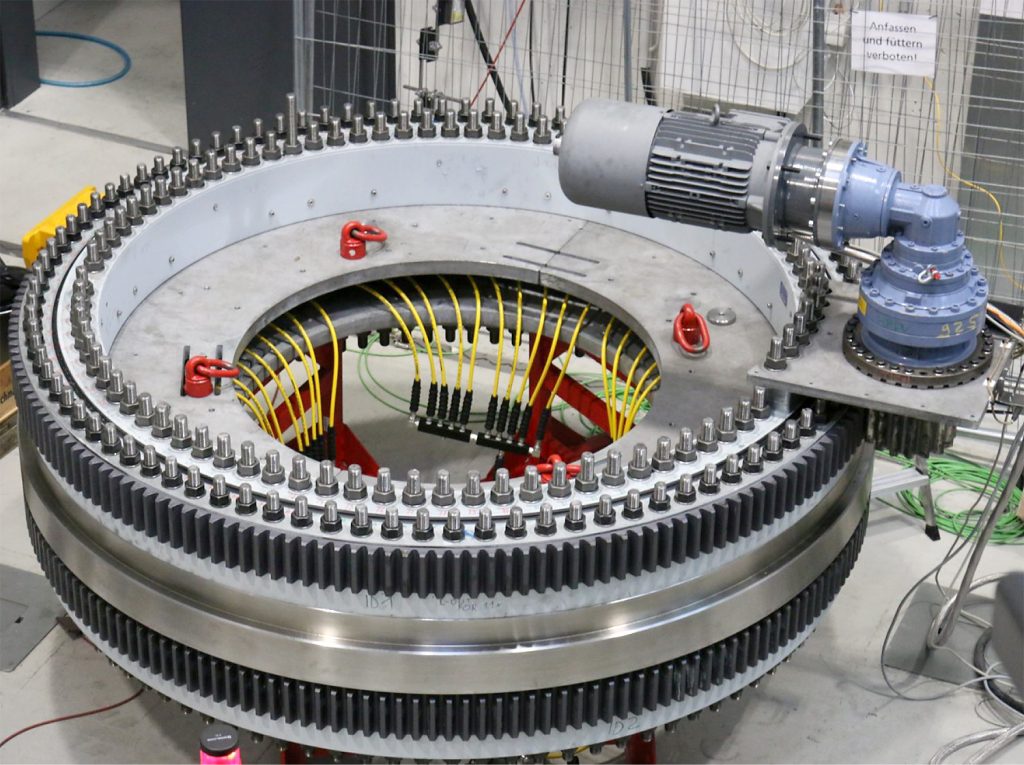
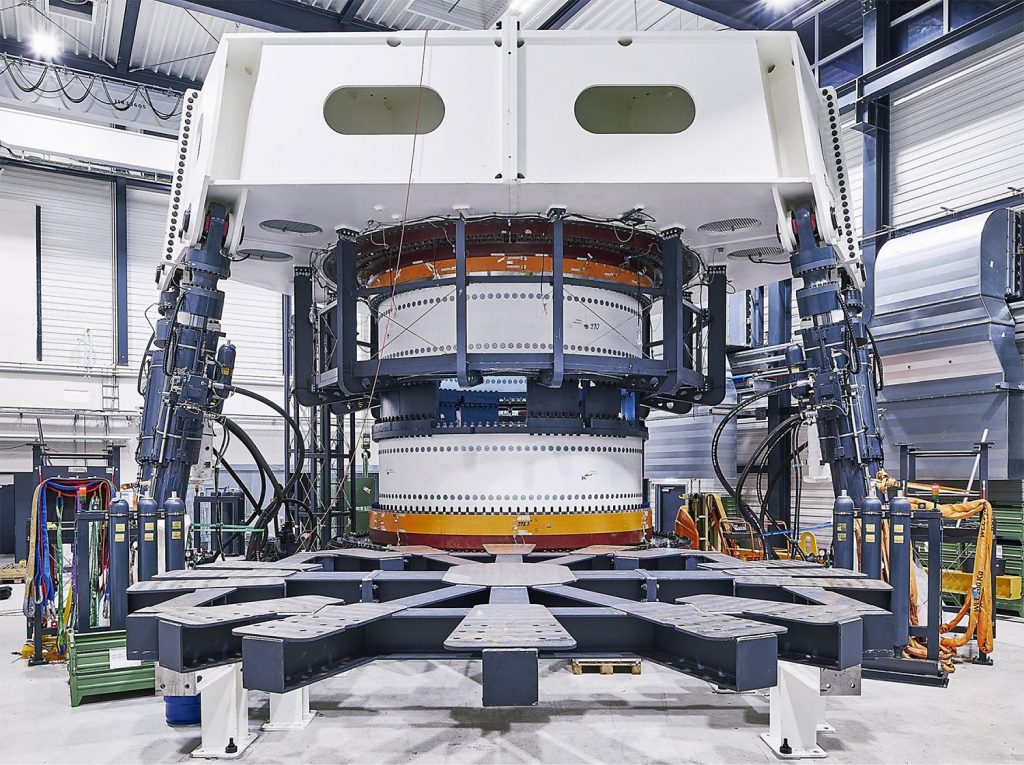
This procedure is explained in detail in [5], and the test results of the BEAT2.1 included here are identical to those in the aforementioned reference, with the only difference being they are not normalized in this article. The “BEAT2.2” shown in Figure 1c is made for the same size of bearings, but it can only apply compressive axial loads. Additionally, the bearings were sourced from a different manufacturer and, therefore, contain four fewer balls, as mentioned earlier. Finally, the “BEAT6.1” shown in Figure 1d is the largest and most versatile of all test infrastructures used in this article. It employs a hexapod design like the BEAT1.1, but additionally uses elements that were designed to represent the stiffness behavior of the blade and hub of the IWT7.5 turbine, respectively.
The bearings in the image are orange. The red structure above the upper and below the lower bearing represents the hub stiffness, and the white structure in the middle represents the blade stiffness. Therefore, this test rig design combines the upside of the BEAT2.1 — the representation of realistic stiffnesses of the surrounding structures of the bearings — with the BEAT1.1’s ability to load the test rig in all six DOF.
Torque measurements were conducted differently depending on the test rig. The BEAT1.1 uses a calibrated torque meter off the shelf between the gearbox and electrical drive. Torque measurements Tmeas thus contain both the bearing torque Tb as well as the gearbox torque Tgb, but the results shown in this article have been corrected for the gearbox by use of an empirical function created by the authors,

where Vz is the rotational speed of the bearing and t is the measured temperature. The values c1 to c3 are empirical variables that were determined by moving the gearbox without any attached bearing. To validate the gearbox torque model above, the corrected torque Tb = Tmeas – Tgb,fit at zero load was then compared to the value given by the manufacturer in the bearing’s test certificates.
Both the BEAT2.1 and the BEAT2.2 use a custom–built torque meter that sits at the end of the gearbox and is thus unaffected by the gearbox torque, but may still be slightly affected by friction of the pinion against the bearing gears. The functionality is also described in [5]. Finally, the tests for the BEAT6.1 were carried out using a hydraulic actuator with a load cell installed at its end, so that only friction at the swivel head of the cylinder is measured on top of the actual bearing torque. The load cell measures a force that is then translated into a torque of the bearings. For all test rigs with two installed bearings, the measured torque was divided by two in order to obtain the torque of one average bearing.
3 FE models
Finite element (FE) analyses were conducted to validate some of the behavior seen in the test results in Section 4. The FE models of the three different bearings are modeled according to the method published by Daidié [11]. This is a common method that reduces the computational effort significantly by means of nonlinear spring elements, which represent the rolling bodies. Rigid beam elements connect the springs with rigid shell elements that lie on the surface of the raceway. The shell elements roughly represent the size of the contact ellipse at a characteristic contact pressure. A force-deflection curve, calculated according to Houpert [12], controls the behavior of the springs. Each spring represents one load-transmitting diagonal of a ball. Therefore, two spring elements represent one ball in a four-point contact ball bearing.
Blade bearings are typically manufactured with negative clearance, i.e., preload of the balls [9], to ensure every ball is in contact with the raceway under unloaded conditions. Due to the modeling approach used and the secure connection of the shell elements with the raceway, it is not possible to model a negative clearance directly. To consider the preload of the bearing, a temperature-dependent behavior of the beam elements is enabled. In the analysis, a defined temperature gradient makes the beam elements expand in a first load step.
This results in a preload force in the nonlinear spring elements. The desired preload force can be calculated using the contact deformation and related contact pressure according to [12]. The 5-meter bearing, for instance, has an average ball oversize of 75 µm. This is equivalent to a negative clearance of 37.5 µm for one ball-raceway contact. The respective ball load of a contact deformation of 32.5 µm is hence used as the ball preload. Then, the temperature gradient in the FE model is set accordingly to match the calculated ball force. The external load is applied in a second load step.
Whereas the external loads are directly applied to the flange surfaces for the FE simulations with the 2-meter and 5-meter bearings, the 0.7-meter bearing is initially implemented in a complete model of the BEAT1.1 test rig structure. The FE model of the BEAT1.1 with implemented bearings is shown in Figure 2.
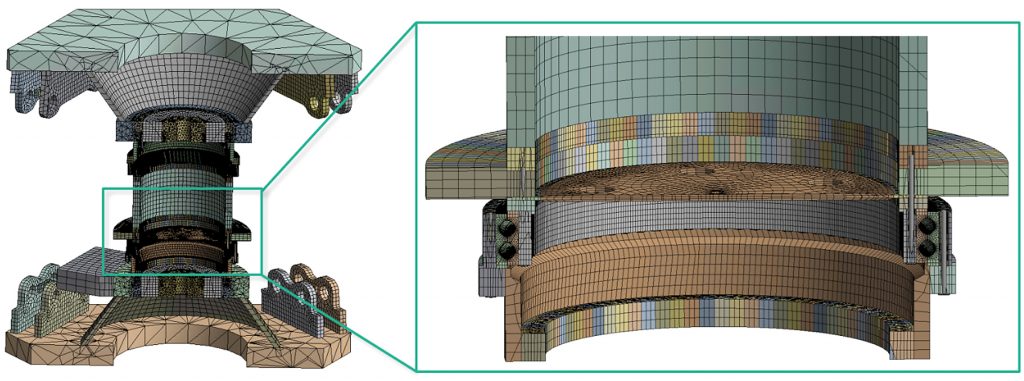
The loads are applied by six joint couplings between the foundation and the upper, actuated platform in order to represent the load application with the six hydraulic cylinders of the test rig. Bolts at both the inner and outer rings of the bearing as well as frictional contacts between all inner cylindrical component flange surfaces ensure a realistic deformation behavior of the structure.
4 Test results
Several bearings were tested on each test rig but the BEAT2.1, which only tested one. All bearings have been subjected to a bending moment and an axial force. Bending moments are the most significant type of load acting on blade bearings [13], since the blade acts as a lever. The bending moment causes an axial load distribution along the circumference of the bearing, with one side being compressed and the other one being under tension. Moreover, axial loads on blade bearings are typically larger than radial loads [13]. For these reasons, an axial load is also applied. The loads were chosen such that they caused a contact pressure of 2-2.5 GPa, since these are realistic values for blade bearings in regular operating conditions [14].
The bearings all performed an oscillating movement, moving forward by 60° (BEAT1.1, BEAT2.2, BEAT6.1) or 10° (BEAT2.1) from an initial position and then back again. Data was recorded with a frequency of 50-200 Hz, and the average absolute torque value during the movement, including the forward and backward movement, was taken. Spikes at the beginning and end of the movement were excluded.
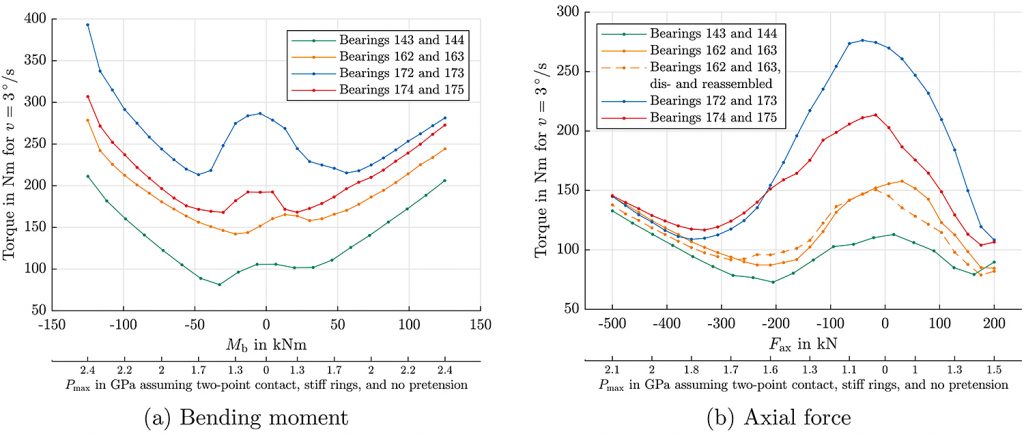
Figures 3 and 4 show the test results for the 0.7-meter bearings. Figure 3a shows the torque under a moment load, with the bearing being subjected to positive and negative moments ranging from minus-125 kNm to 125 kNm. Results for axial loads ranging from minus-500 kN to 200 kN are displayed in Figure 3b. There are two scales given for the abscissa, with one showing the global load acting on the bearing denoted Mb for the bending moment and Fax for the axial load. The scale below shows the maximum contact pressure that follows from a simplified model of these bearings with stiff rings, zero clearance, and two-point contact. This is intended to allow for better comparison of the results of differently sized bearings.
The results show a significant difference in torque at zero load for the bearings although they are of identical type and produced in the same batch. At Mb = 0 as well as Fax = 0, the bearing is essentially unloaded (more precisely, the lower bearing is unloaded; the upper one will experience slight tension due to the compensation of the weight of the blue steel tube between the two bearings). The friction torque varies by a factor of more than three between bearing IDs 172/173 and 143/144. These differences correspond to the friction torque measured by the manufacturer and documented in the bearing’s acceptance test certificates, and bearings were sorted in pairs so these values resemble each other.
The differences thus likely stem from manufacturing fluctuations; that is to say, differences in external clearance: Due to quality fluctuations in the manufacturing process, the preload varies, and its actual value has a significant effect on the friction torque, as has been shown by Chen et al. [9]. Bearings are usually assembled by introducing a set of balls within a defined diameter range and checking if the torque is within specifications, and the range of allowed torque is often broad since there is no requirement to reach an exact value. In this case, it was merely specified for the bearings to have negative clearance, without any initial torque range being specified.
Differences in the torque between the bearing sets can be seen to decrease as an external load is applied, particularly for the high thrust loads in Figure 3b. This appears to validate the theoretical results of Heras et al. [7], who modeled a bearing with manufacturing faults and concluded that their effect on the load distribution decreases as external loads increase. However, there are still major differences in the torque at high moments, even despite the high associated contact pressures (see Figure 3a).
Furthermore, it is noted that, at low loads between 0-1.5 GPa, the torque drops when the absolute value of loads is increased. This seems counterintuitive, as friction is typically assumed to be roughly proportional to the normal load. Two factors likely play a role here: The bearings have four-point contacts, and they are preloaded, as mentioned earlier.
This means that, for zero load, the friction torque is given by the sum of four contacts per ball. As the load increases, the contact eventually turns into a two-point contact [3], and it is likely the transition occurs at these low pressures and, therefore, causes the drop in friction torque. FE analyses were conducted to validate these theories. Using a ball oversize of 35 µm to reach negative clearance, the transition from four- to two-point contact occurred fully at Fax = minus-200 kN and Fax = 180 kN for axial loads and at Mb = ±30 kNm for bending moments. These points correspond well to the local minima of the torque shown in Figure 3.
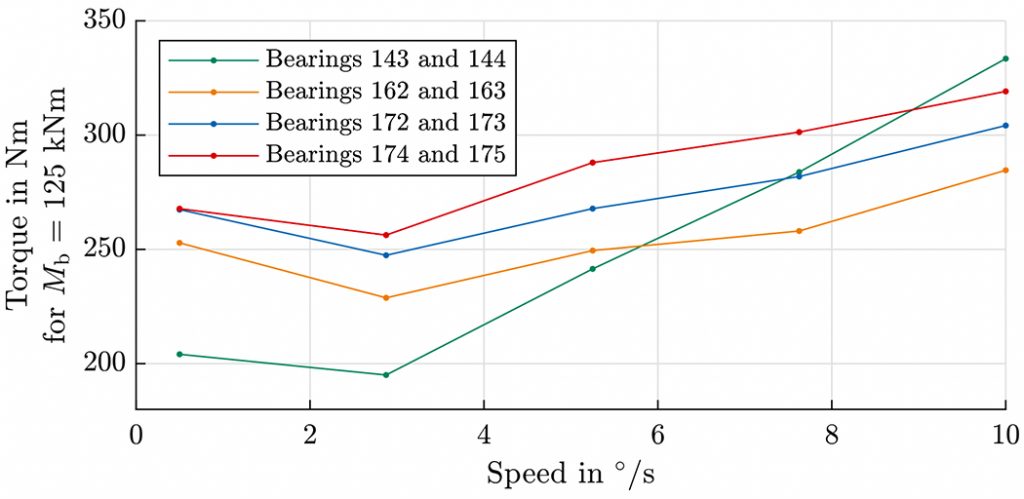
Speed influence of the torque is depicted in Figure 4 for a constant bending moment of Mb = 125 kNm. Speeds were chosen to represent actual operating speeds in a turbine. Generally, an increase in the torque at higher rotational velocities can be observed, but the exact influence of the speed on friction torque appears to change depending on the bearing. For bearing IDs 143/144, the influence is significant, and the torque at a rotational velocity of 10°/s is over 60 percent higher than at the low speed of 0.5°/s. For the other bearings, the increase between these two points is below 15 percent. Similar behavior was also evident at other loads not included in this article.
The results for the 2-meter bearings are given in Figures 5 and 6. Note that the axial and moment load cases have been obtained with two different test rigs as explained in Section 2. The impact of the bending moment on friction torque is given in Figure 5a for a single tested bearing at different rotational velocities. The effect of the rotational speed is observed to be almost negligible, while the influence of the moment is significant. Unlike in the other plots shown in this article, there is no visible drop in the torque for an increased moment. This is likely due to the resolution of the measurement data: As seen in Figure 5a, the torque was only measured at 0 MNm and 2 MNm, corresponding to 0 GPa and 1.9 GPa, respectively. The transition from four- to two-point contact likely occurred in between these two measurement points and is therefore not visible in the figure.
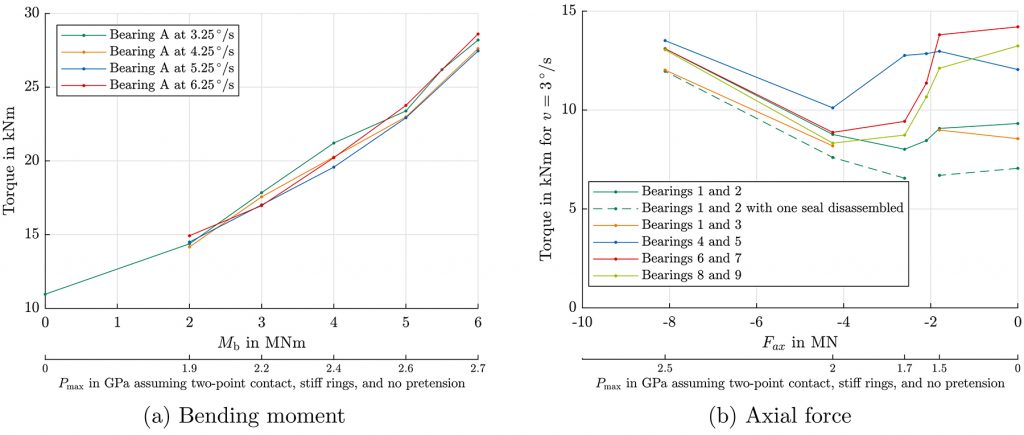
Moreover, due to the design of the BEAT2.1, the blade had to be disassembled for the 0 MNm measurement, and, therefore, the blade flange was not preloaded with bolts as it was for the other measurements. This may also have slightly decreased the torque at zero load. Finally, as seen in Figure 3, the axial load appears to cause a greater drop in torque, since all balls transition from four- to two-point contact at the same time with an axial load, whereas the transition is more gradual for a bending moment and may thus be less visible in the data.
This theory is further supported by the behavior of the bearings under an axial thrust load depicted in Figure 5b. Here, a clear drop in the torque is visible in the region between 0 GPa and 2 GPa contact pressure.
Again, as already seen for the 0.7-meter bearings, the effect of manufacturing fluctuations appears to cause significant differences in the torques in an unloaded state of the bearing. These differences decrease for a high thrust load in a very similar manner to those of the 0.7-meter bearing, converging against each other and, thereby, further supporting the simulations of Heras et al. To validate whether the drop may be caused by a transition from four-point into two-point contact, FE simulations were performed and showed a transition at a load of 2.6 MN for a ball oversize of 45 µm.
Bearing IDs 1/2 were tested with a disassembled upper seal on one of the bearings, and the results are compared to the bearings with a complete set of seals. The effect of the seal on friction torque appears to be roughly constant, particularly at higher loads.
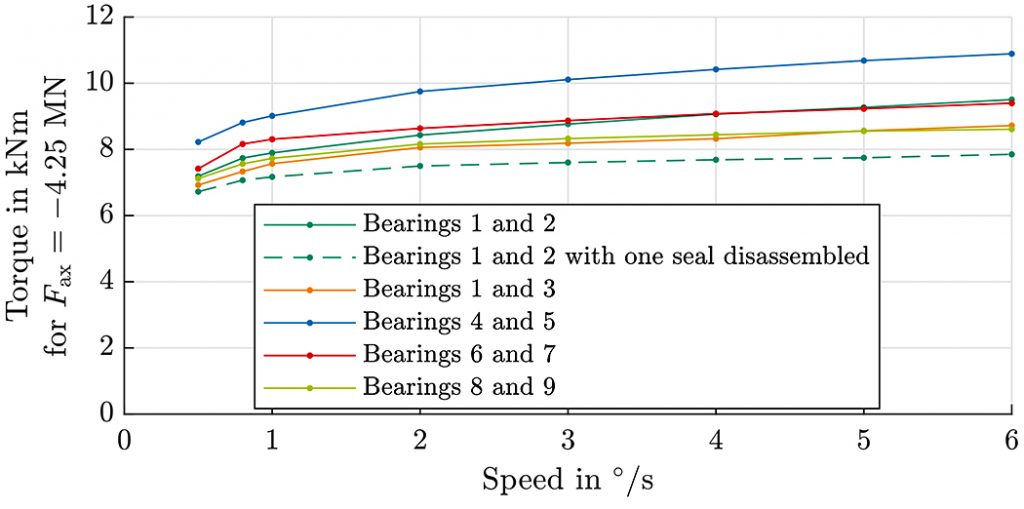
Additionally, all bearings were tested at different rotational velocities on the BEAT2.2 test rig. The results for a thrust load of Fax = minus-4.25 MN are given in Figure 6. As already seen with the 0.7-meter bearings, the effect of the speed on friction torque appears to depend on the particular set of bearings that were tested. Furthermore, a slight increase in the torque is observed at higher rotational speeds, ranging from 20 percent to 30 percent depending on the bearings. As above, bearings IDs 1/2 were also tested with one disassembled seal, and the offset is again roughly, though not exactly, constant over all speed levels.
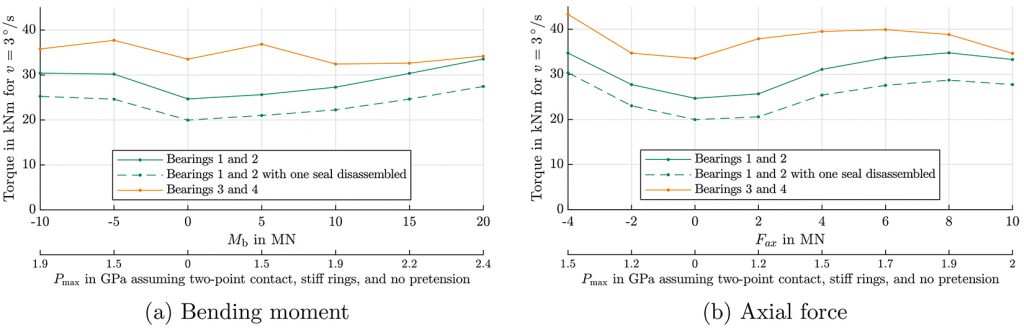
Finally, test results for two sets of 5-meter bearings on the BEAT6.1 test rig are given in Figure 7. These data were obtained for a rotational speed of 3°/s only, again for a bending moment and an axial load. Bearing IDs 1/2 use a rotationally symmetric steel tube to connect the bearings, while IDs 3/4 use a hybrid construction of glass-fiber reinforced plastic and steel described in [3] that reflects the stiffness behavior of the blade. The results for the bending moment are given in Figure 7a.
For bearing IDs 1/2, an almost linear increase for the positive moment is observed similar to the result for the 2-meter bearings, and again there is no visible drop in the torque at low loads, likely due to the low resolution of data points with respect to the contact pressure. For bearing IDs 3/4, an increase in the torque is observed at Mb = ±5 MNm for a contact pressure of 1.5 GPa.
This behavior is in principle similar to that seen with some of the 2-m bearings in Figure 5b.
For the axial force, the behavior of both sets of bearings is comparable to that of the 0.7-meter and 2-meter bearings. The torque visibly drops after 1.7 GPa to 1.9 GPa. As above, this is likely due to a transition from four-point into two-point contact, and FE simulations have been performed with balls oversized by 75 µm that demonstrated the transition at an axial load of 9.8 MN. Compared with the earlier results, it is highly likely that, for higher contact pressure, the torque would increase again in an approximately linear fashion.
For both the moment and the axial load, the torques of both sets of the 5-meter bearings appear to converge against each other at the highest tested load. Furthermore, the upper seal of bearing IDs 1 and 2 was disassembled, and the difference in torque is almost constant over all load levels tested.
5 Friction torque curve fit
The previous section suggests individual bearings can show significantly different behavior under otherwise identical conditions, particularly at low loads. This means common models such as those in [5] cannot predict the behavior of blade bearings accurately, since none of them takes into account the differences that cause these individual effects. Moreover, pitch bearings rarely operate under long steady movements, but rather have varying loads and speeds, meaning the influence of these factors must be determined.
We therefore propose an empirical approach to model the friction torque of a particular bearing. This can be fit to a bearing using measurement data taken from operation or a test. Using the fit, and by continuously monitoring the bearing during operation, it is then possible to perceive changes in the bearing’s behavior. As explained in Section 1, these changes indicate degradation occurring within the bearing and may thus be used to forecast a required exchange of the bearing during future maintenance operations.
In order to generate data for the model, a full factorial test plan was devised. This was used for each of the 0.7-meter bearing sets. The resulting moment Mres was changed from 0 kNm to 125 kNm in steps of 25 kNm, and the angle a of the resulting moment was changed from minus-45° to 45° in steps of 22.5°. Rotational speed Vz was varied from 0.5°/s to 10°/s in steps of 2.375°/s and the axial force Fz varied between 0, 25, and 50 kN. Combining all these steps into a full factorial design results in 391 data points for which the torque was recorded and analyzed as described in the previous section.
The model for friction torque Tfit is then proposed as
![]()
where the constants c1 to c9 have to be determined for each individual bearing (or set of two, as is the case for most test rigs in this article). The terms in the right brackets of Equation 2 represent the load-dependent behavior of the bearing. As the moment Mres increases, the torque goes up; merely in the beginning, there is a local maximum for which the term c7e–c8Mres has been included that drops off to 0 for large Mres.
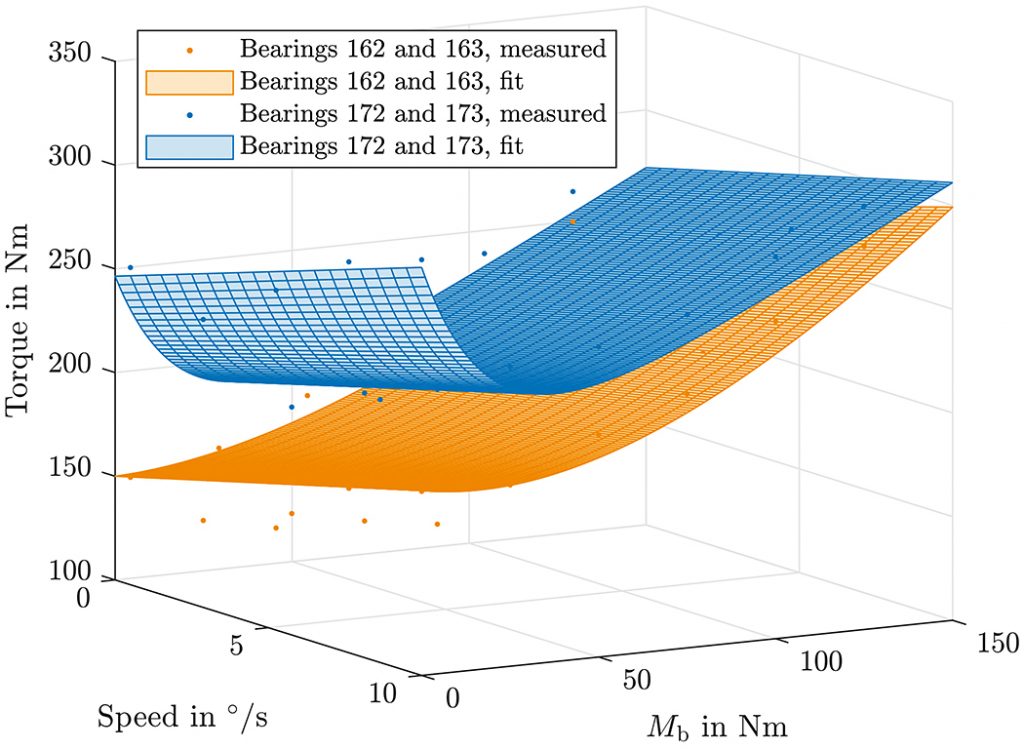
Similarly, an increase in the axial force Fz generally leads to an increase in torque; here, too, an exponential term could be included to consider the drop off in the beginning but has not been used here due to the small range of axial loads covered in the test plan. The terms in the left brackets are intended to include effects from the lubricant, which may be expressed in terms of the speed Vz, and an effect of the direction of the resulting moment a, which in the results produced by the authors had some influence because the test assembly is not perfectly rotationally symmetric. Using this model and deriving a value of c8 through “trial and error” methods, the rest of the equation can be expanded to obtain an equation that is linear in all terms and can thus be easily solved. Solving it for bearings 162 and 163 as well as 172 and 173 of Figures 3 and 4 gives the results displayed in Figure 8.
The effect of the e-function term at low moments is clearly visible, particularly for the bearings 172 and 173, and the torque can correctly be seen to increase for higher speeds. However, although the result is better than using available models (cf. [5]), the fit could still be improved further. The root-mean-square error is 13.77 Nm for bearing IDs 162/162 and 18.23 Nm for IDs 172/173.
As mentioned earlier, after the model has been validated, it could be used to track the bearing behavior and identify potential damage. This could be accomplished by taking repeated measurements of the friction torque during operation and by comparing these measured values to predicted ones from the model. Once the difference between the measured and the predicted values exceeds a predefined threshold, a possible damage could be detected. Such a threshold could be defined in the beginning of turbine operation, when the bearing is known to be intact and deviations from the model are therefore known not to be critical.
6 Conclusions
Multiple double-row four-point bearings of three different sizes were tested on four different test rigs and the friction torque at different bending moments and axial loads of the bearings measured. The results showed significant discrepancies in the torque of identically sized bearings.
This is likely due to manufacturing fluctuations that cause a difference in negative clearance between the otherwise identical bearings, and similar behavior has been shown by Chen et al. [9]. The effect of this discrepancy diminishes as external loads increase, which supports simulations performed by Heras et al. [7], who observed that manufacturing errors have a decreasing effect on the internal load distribution for increased external loads. At low contact pressures under 2 GPa, a drop in the torque was observed for increased external loads. This is likely due to a transition from four-point into two-point contact, and FE simulations have been performed to validate this hypothesis for all bearing sizes. Furthermore, it was noted that rotational speed appears to have an effect on the torque that varies between bearings and that is relatively small, but not negligible for most of the tested bearings.
In order to model the friction torque, an empirical equation was suggested. This allows for curve fitting of the torque under various load combinations and can be tailored to a particular bearing or a set thereof installed on a test rig. Using the model, it is possible to track continued degradation, though the model still leaves room for further improvement.
About the authors
O. Menck, K. Behnke, M. Stammler, A. Bartschat, F. Schleich, and M. Graßmann are with the Fraunhofer Institute for Wind Energy Systems IWES. Published under licence by IOP Publishing Ltd. This article is an open access article (https://iopscience.iop.org/article/10.1088/1742-6596/2265/2/022087) distributed under the terms and conditions of the Creative Commons Attribution (CC BY) license (https://creativecommons.org/licenses/by/3.0/). This article has been edited to conform with the style of Wind Systems magazine.
References
- Stammler M, Reuter A and Poll G 2018 Renewable Energy Focus 25 40–47 ISSN 17550084.
- Heras I, Aguirrebeitia J, Abasolo M and Plaza J 2017 Tribology International 115 59–69 ISSN 0301679X.
- Stammler M, Thomas P, Reuter A, Schwack F and Poll G 2020 Wind Energy 23 274–290 ISSN 1099-1824.
- Harris T A and Kotzalas M N 2007 Rolling Bearing Analysis, 5th Edition (Boca Raton: Taylor & Francis)
- Stammler M, Schwack F, Bader N, Reuter A and Poll G 2018 Wind Energy Science 3 97–105.
- Zhang M Z, Li H T and Zhao H T 2011 Advanced Materials Research 189-193 2601–2604.
- Heras I, Aguirrebeitia J, Abasolo M, Coria I and Escanciano I 2019 Mechanism and Machine Theory 137 23–36 ISSN 0094114X.
- Stammler M 2020 Endurance test strategies for pitch bearings of wind turbines Dissertation Leibniz University Hannover.
- Chen L, Li Z G, Qiu M and Xia X T 2014 Journal of the Brazilian Society of Mechanical Sciences and Engineering 36 461–467 ISSN 1678-5878.
- Menck O, Stammler M and Schleich F 2020 Wind Energy Science 5 1743–1754.
- Daidié A, Chaib Z and Ghosn A 2008 Journal of Mechanical Design 130 ISSN 1050-0472.
- Houpert L 2001 Journal of Tribology 123 589–594 ISSN 0742-4787.
- Schwack F, Stammler M, Poll G and Reuter A 2016 Journal of Physics: Conference Series 753 112013 ISSN 1742-6588.
- Schwack F 2020 Untersuchungen zum Betriebsverhalten oszillierender Wälzlager am Beispiel von Rotorblattlagern in Windenergieanlagen Dissertation Leibniz University Hannover.


