


Wind power has come a long way in the past decade. Thanks to billions of dollars of investment, wind power has grown faster than any other renewable energy source in the U.S. As investors such as BlackRock announce their commitment to divest from fossil fuels, the wind sector is likely to see even more growth.
Investment comes with a clear expectation that wind projects will hit their forecasted power output. However, as we saw in 2019 with Ørsted, even the largest and most established names in the industry can suffer as a result of missed forecasts. To avoid this, owners and operators must ensure that their turbines are operating at peak performance and making the most of the available wind resource.
However, many performance issues are not easily identified through the vast quantity of data — often poorly labeled — that a wind farm feeds back to the owner. For example, a 2-percent dip in turbine performance due to blade pitch misalignment can be difficult to identify from SCADA data alone, especially as a fluctuating wind resource provides an easy scapegoat for an asset achieving a lower output than expected.
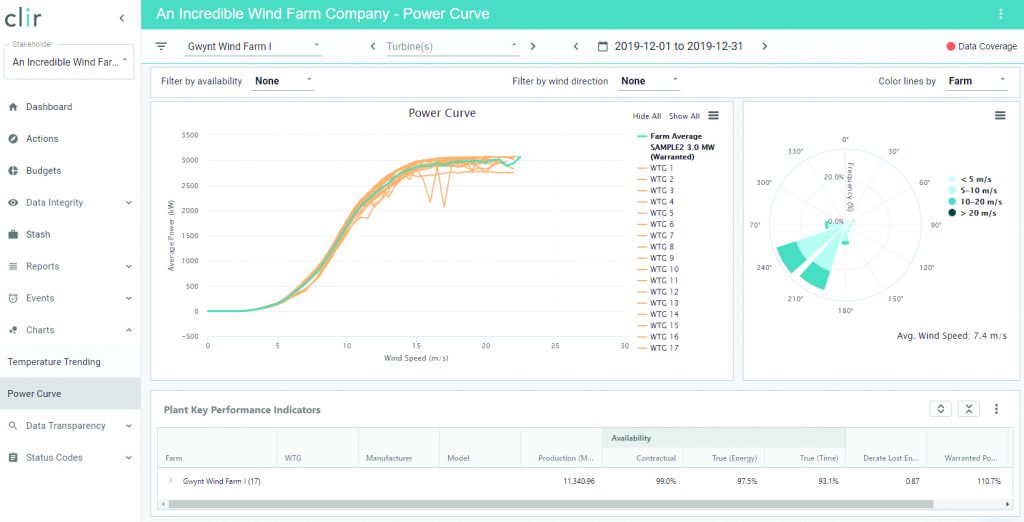
In order to understand the true causes of asset underperformance, digital tools are crucial for rapidly sorting through and comparing data streams. Clir has developed an advanced algorithm, driven by artificial intelligence (AI), which allows the company to identify not only when the turbine is underperforming but indicates what is causing the underperformance. This gives asset owners the information they need to act and ultimately increase their asset’s annual energy production (AEP). (See Figure 1)
Through analyzing data from more than 6 GW of assets globally through its platform, Clir has identified a number of common underperformance scenarios that are easily missed through traditional data analysis methods.
The Wake Effect
Trees, tall buildings, and even other turbines across the wind farm can change the behavior of the wind resource in its wake for hundreds of meters. A more turbulent wind resource leads to a greater fatigue load on the turbine, decreasing its generating potential and increasing wear-and-tear. As such, the impact of tall structures on the ability of downwind turbines to generate energy as forecast can be enormous.
Last year, Ørsted revealed that the blockage effect had caused a 2-percent decrease in AEP for their offshore assets compared to the forecasted output. While it’s key that the impact of the blockage effect on wind-farm output must be better accounted for in forecasting, there are a number of cases where this effect can actually be reduced.
Analyzing both turbine data and environmental data is crucial for adjusting a wind turbine’s surroundings to counteract the wake effect. Clir digitizes not only the turbine but the surrounding environment in order to understand the relationship between the asset and the wind resource that reaches it.
For example, for one project Clir fed wind resource data gathered from a forested area surrounding a wind farm onto Clir’s platform and compared it with performance data from each turbine. By doing this, Clir could pinpoint exactly which trees were causing a significant wake effect. This informed a targeted felling strategy that, if implemented, could see the owners of this particular wind farm reduce turbulence and fatigue load on the turbines, increasing AEP by 10 percent.
Pitch and Yaw Misalignment
In order to make the most of available wind resource, the nacelle and blades must be properly oriented to the wind direction. Sensors on the turbine detect the direction of the wind and angle the turbine toward the resource; however, in the course of installation or maintenance, these sensors can be mis-calibrated. This leads to static misalignment of pitch and yaw, driving the turbine nacelle and blades away from the wind resource and slowing the turbine down. Static yaw misalignment by as little as 4 degrees can result in a 1-percent loss in AEP.
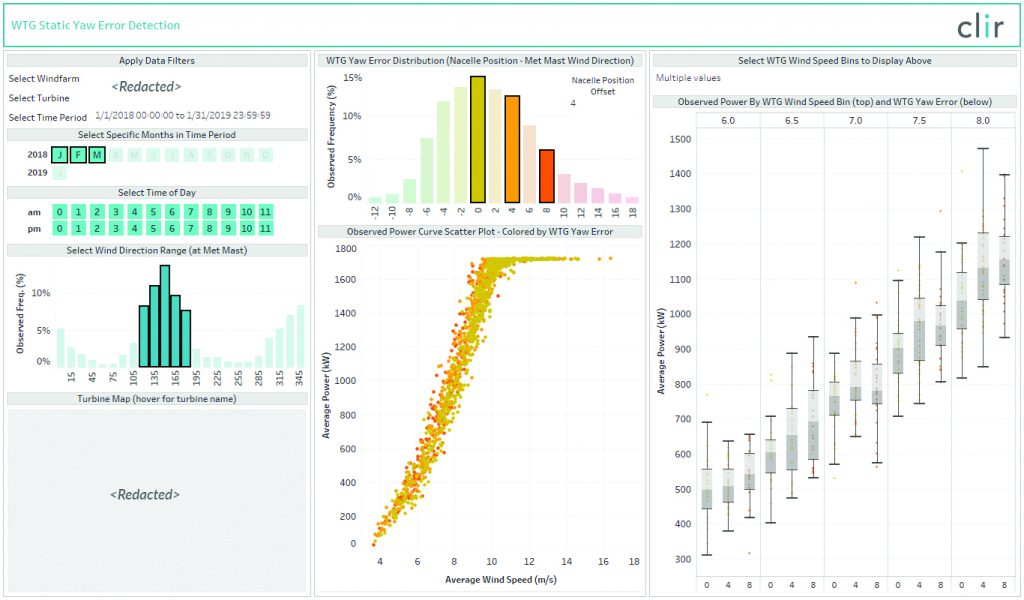
For example, Clir was able to identify a client’s wind turbine was producing power at its best when the sensors reported the nacelle was misaligned from the wind direction by 8 degrees. Clir’s AI compared this result against met mast data, which confirmed the turbine was, in fact, misaligned from the true wind direction. Following realignment, AEP increased by more than 3 percent. In order to sift through the data and find out whether misalignment is occurring as quickly as possible to prevent lost output, advanced digital tools are necessary. (See Figure 2)
‘Minor’ Damages and Defects
Minor faults and damages to turbines and their components are often missed during normal monitoring of a wind farm. As more owners and operators take a predictive approach to operations and maintenance to reduce the chance of major failure down the line, identifying these faults at the earliest opportunity is more important than ever.
The small damages or faults that preclude a major failure have an effect on turbine performance in and of themselves. For example, a gearbox showing early signs of wear-and-tear will run less efficiently than a fully operational gearbox, and therefore generate less energy. As these “minor” faults build up, there is cumulative loss of AEP.
AI can help identify these low-level faults by rapidly analyzing data and identifying any anomalies. For example, unusual temperature patterns can indicate sensor error or that the turbine is undergoing mechanical stress, indicating damage and potential breakdown. Rather than assuming that underperformance is due to wind resource, AI cross references data across the turbine, environment, and resource, allowing owners to identify, confirm, and fix “minor” issues that would otherwise be missed.
Unnecessary Derating
Derating, or the downregulation of turbine performance, can help limit export to the grid at capacity and prevent wear-and-tear when applied correctly.
Controlled underperformance here is a necessary evil, however, if derating is applied when it doesn’t need to be over the course of a year, the wind farm could lose up to 5 percent AEP a year.
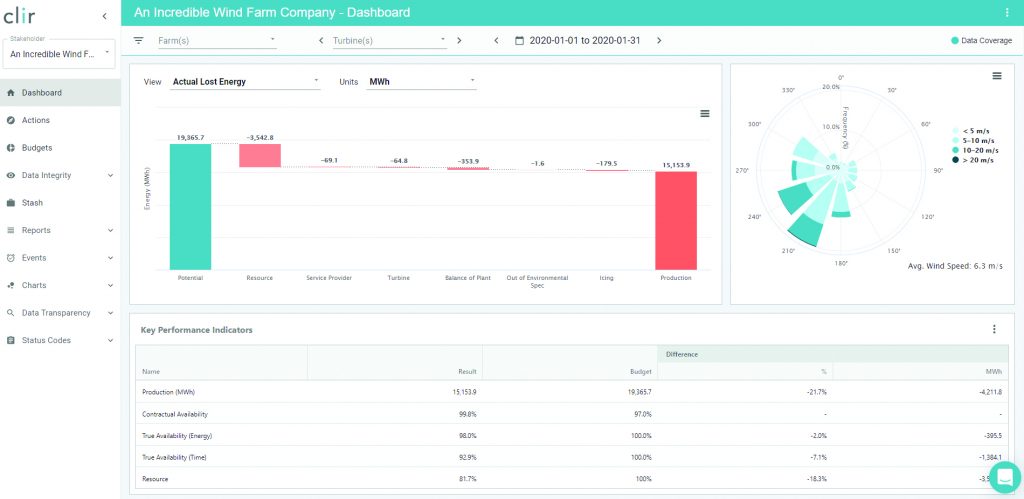
Underperformance due to derating tends to be subtle, with the decrease in turbine performance usually less than 5 percent. It is easy for this level of underperformance to be missed with traditional analysis methods as it can be lost in the noise of influences such as wind resource. In contrast, AI is able to detect derating by identifying regular incidents of underperformance and recognize whether this derating is necessary — informing asset owners and operators of when to rethink their derating strategies. (See Figure 3)
The majority of wind farms across the globe are underperforming without the asset owners’ knowledge. Improving turbine performance is crucial not just for increasing energy generation, but for maximizing revenue across the wind farm’s operational life.
With more investment channeled towards wind than ever before, owners cannot afford to view underperformance as out of their control. By using advanced digital tools to not only identify underperformance, but to understand the reasons behind it, owners will be able to maximize energy production across their assets, regardless of wind resource. In short, understanding and taking control of turbine performance can be the difference between missing a forecast and exceeding energy production.


