Home April 2010

April 2010

Equipment shortage possible on a global scale

In the January issue we noted that 2010 promises to be a challenge for the wind power industry as general equipment availability and transport capacity begins to tighten up, placing additional constraints on supply chains. As more countries enter the market, the shortage of equipment to transport and to erect wind farms will be felt on a global basis in the second half of 2010 and into 2011. This is due to three converging issues:

1) Projects already planned for this year;
2) Projects that were delayed from last year for financial and other reasons, and;
3) New regional and global companies entering the market.

Many countries are deciding to focus on renewable energy, particularly green energy, to meet their increasing demand for electricity. Countries such as South Korea are investing in, as well as entering the market, and Hyundai and Daewoo shipyards recently joined the drive for renewable energy. Plus, the South Korean government is investing billions to bring companies up to par with the current global players. One of their projects in Canada is expected to supply 1,000 wind turbines in 2011.

According to the China Renewable Energy Society, the total wind power capacity installed in that country is anticipated to reach 20 million kW this year. International consulting firm Frost & Sullivan recently estimated the cumulative installed capacity of China wind power to exceed 100 million kW in 2020, a compound growth rate between 20-30 percent from 2009 to 2020.

Meanwhile, in Europe, project developers in the northeast of England are looking for companies to invest in the region because of the higher demand for offshore services in the North Sea. The UK government seeks to increase the amount of wind-driven electricity generation by five times within a decade to help reduce the nation’s carbon emissions and to produce about 32 GW of electricity by 2020. This presents logistical challenges, as many of the offshore sites are in depths of up to 60 meters and in some instances are far from land. As many as 10,000 wind turbines, based on current technology, may be necessary to meet their plan of 32 GW, which means installing around 1,000 a year.

All this activity means that wind energy companies will be competing for capacity, especially as new players increase the demand for equipment. And as more wind power construction companies enter the market, demand will outstrip supply, creating a world shortage of transportation sources and logistics expertise. Currently, for example, there are only so many ships that can handle some wind power components, and plans to build massive 10 MW turbines are already under way, which means blades will increase in size. This places additional pressure on transportation capacity and the necessary equipment to handle large components. Vessels must be able to accommodate the larger equipment, as well as the increased volumes. Before the increase in equipment sizes, larger quantities of components could be loaded on a ship. That is changing. Construction barges for offshore farms are in short supply. Laydown areas have to be bigger because of higher volumes of shipments at the ports. The list goes on.

Market changes and equipment challenges demand a high level of logistics management expertise. Wind power companies that focus on and invest in the right resources will be in a leadership position in the future marketplace. Planning processes must be in place, including operational processes that can help smooth out the inevitable bumps of transportation equipment volatility. Dealing only with local resources often requires extensive management and could result in sourcing problems. Look for a wind power logistics solutions developer that can bring all the necessary partners to the table, preferably a company with global reputation and reliable infrastructure; a company with global sourcing capabilities, depth of knowledge, local expertise, and a wide range of transportation and port partnerships.

Conversation with Oliver Hirschfelder

Tell us a little about your professional background prior to joining Capital Safety earlier this year.

My most recent position was president and CEO of Hailo LLC, where I worked for approximately seven years and was responsible for the German-based company’s entry into the North-American market. Hailo’s products include ladders for applications including wind towers, cranes, shafts, and pipes, as well as fall protection systems. Before that I had worked in sales and marketing for companies such as Proctor and Gamble, van Melle Deutschland GmbH, and BIC Germany GmbH. I was a founding member of the American Wind Energy Association’s safety committee, as well as its operations and maintenance group, of which I am currently on the steering committee. So not only do I have a great deal of experience with safety and fall protection, but also how they apply specifically to the wind industry.

What drew you to this new position, and what are your responsibilities?

While Capital Safety — which is also known as DBI-SALA — has been heavily involved in the wind industry for quite some time now, they created this position in order to unify its wind-related operations both here in the United States and around the world. I felt that the skills and experience I’ve accumulated over the years put me in an ideal position to succeed in this role, serving as a bridge between the company and its customers in terms of product development.

In fact, acting as a liaison between the company and those who actually use the products it designs and manufactures is one of my primary responsibilities in this position, and something that I’m very comfortable with. I will oversee the efforts of our wind-related sales force around the world, in addition to handling marketing activities within this sector, and I will also spend a great deal of time traveling to meet with our clients, asking the technicians — who are the actual end users of our harnesses, for instance — how we could improve on the product, no matter how small their concern may be. When you take our new ExoFit NEX full-body harness into consideration, for example, the attention to detail is quite remarkable, and a great many of the improvements came about by our direct communication with safety engineers and field technicians. A one-time adjustment means that workers won’t need to adjust their harnesses throughout the day. The straps won’t budge, even with the weight of tool belts that have traditionally caused adjustments to loosen.

In addition the hardware is constructed of aluminum, reducing the overall weight of the harness, which increases comfort. The harness is constructed with Repel Technology Webbing, providing extreme durability with up to five times more abrasion resistance and water repellence than previous generations of harnesses, and the breathable padding wicks away moisture to keep the worker cool and dry. So these are just a few examples of the upgrades and improvements we’ve made as a direct result of our customers’ comments and concerns. We realize that the quickest way to arrive at the best designs for our fall safety equipment is to listen to the individuals who will be wearing it all day long, and sometimes something so small as adding a pocket for a cell phone can make all the difference between a harness you’re required to use and one that you actually want to wear.

So all a technician or safety professional needs to do is contact you if they have a suggestion, or a need for customization of any of your devices?

That’s right. I will be working with our key customers—which includes manufacturers, wind farm owners and operators, and construction and service firms—to provide fall protection solutions for all of their employees who work at heights. And this degree of customer service is well worth it for us, because the more we can keep the lines of communication open between Capital Safety and our customers, the more successful we’ll be in producing products of the highest quality that will help them to achieve their internal safety goals.

For more information: Call (800) 328-6146, send e-mail to solutions@capitalsafety.com, or go online to www.capitalsafety.com.

Company Profile: Mortenson Construction

0

After spending three decades working in the construction industry, M.A. Mortenson, Sr., decided that it was time to start a company of his own. So on April 1, 1954—April Fools’ Day, no less—and at 48 years of age, he took the leap. “I had mixed emotions as I hung out my construction shingle,” he has written of that day. “Most companies don’t survive their first few years, and I knew that it would take some breaks along the way to make it.”

By the time he passed away in 1986 he had lived long enough to see Mortenson Construction, which was founded and is still headquartered in Minneapolis, do far more than merely “make it,” evolving into a massive entity with a global presence that is active in a wide variety of projects, including wind-farm engineering, procurement, and construction (EPC). The first such farm was completed in 1995, according to Jerry Grundtner, the company’s vice president of project development.

“It consisted of erecting a single Vestas wind turbine in Adair, Iowa,” he says. “We installed two that year in the same state, as a matter of fact. And while it was great experience for us to get started by working on smaller projects, our involvement in the wind industry has grown along with the ever-increasing scale of the projects themselves.”

So much so that the company’s Wind Energy Services—which is housed within its Renewable Energy Groups umbrella, alongside sectors devoted to solar energy and biofuels—has completed some 87 wind power facility projects throughout North America to date. That effort has resulted in the installation of 4,747 turbines providing 8,455 MW of electricity, making up 24 percent of the nation’s existing wind power capacity. That’s equivalent to pumping renewable energy into approximately 2.1 million average U.S. households.

According to Grundtner, Mortenson is a design/build EPC contractor of wind energy projects, and despite its level of involvement on a particular job two things always remain the same. “We always erect the turbines, using our own crews, which is pretty rare,” he says. “And we always handle the foundation work ourselves, all the way from the design to the forming, pouring, and installation. About 80 percent of our work is turnkey, providing all of the EPC aspects so that we’re building the farm from start to finish, including roads, collection, and substations.”

With projects ranging from Maine to Hawaii, and from Texas to British Columbia, the company has played a significant role in the development of wind power in the North American market. But it also supports the industry in other ways, including building the most-recent addition to the National Renewable Energy Laboratory’s campus and the new nacelle and blade manufacturing facilities commissioned by Vestas, all of which are located in Colorado, where Mortenson Construction has an office in Denver. Others are found in Chicago, Illinois; Washington, D.C; Madison and Milwaukee, Wisconsin; Phoenix, Arizona; Seattle, Washington; and Shanghai, China.

With other divisions consisting of its Federal Contracting Group, Full Service Facility Solutions, Mortenson Development, Inc., and its Sports Group, the company harnesses the expertise it has amassed as an early entrant into the wind-farm construction market via R&D relationships with various tower and turbine manufacturers, developing leading-edge technologies to the benefit of the industry at large. “We’re currently working with a couple of manufacturers who are intending to deploy 100-meter towers in the near future,” Grundtner says, “so we’re helping them work out the details in terms of the logistics and overall cost-effectiveness of such an endeavor.”

As a family-owned company—M.A. Mortenson, Jr., is currently chairman, David Mortenson is executive vice president, and Mark Mortenson is corporate secretary—Mortenson Construction possesses the financial strength to enter into wind-farm projects of any size with confidence. “We’ve been committed to the wind-energy business for 15 years now, and we are one of the leading contractors in this particular market, so we want to be proactive in its continued growth and development.

“We have the ability and expertise to support our customers on their smallest projects all the way up to their largest, which isn’t something everyone can do,” Grundtner says. “But Mortenson Construction certainly can.” 

For more information:

Call (763) 522-2100 or go to www.mortenson.com.

An Alternative Design for Speed Increasers

The AWEA WINDPOWER show always provides impressive demonstrations of the latest and greatest achievements in all the areas of science and technology that are related to wind-power generation. Wind turbine gearbox suppliers present the very best gear alloys, forging and cutting processes, the mirror-like tooth surfaces achieved by the isotropic superfinish technology, and the best bearings and lubrication systems, etc.

In contrast with these innovations, the gear tooth geometry of almost all gearboxes has become outdated. In most cases it presents century-old tooth proportions produced by the standard 20o pressure angle generating racks with some addendum modification. This tooth geometry is universal and good for general gear applications because of gear interchangeability and the availability of standard tooling. It does not fit to the specific operating conditions and requirements of wind turbine gearboxes, however, which include a long lifetime of some 20 years, relatively low speeds, high static loads, size and weight constraints, high efficiency, noise and vibration limitations, and low cost of fabrication and maintenance, etc. The gear tooth geometry must be customized to satisfy all of these conditions.

Unlike the traditional standard gear design, the proposed alternative Direct Gear Design method does not use the basic rack parameters. It uses desired performance parameters and operating conditions to define the optimized gear tooth shape. This design approach is developed for involute gears and based on the theory of generalized parameters created by E.B. Vulgakov [1], and it can be defined as an application-driven gear drive development process with primary emphasis on performance maximization and cost efficiency without concern for any predefined tooling parameters.

Gear Tooth and Mesh Synthesis
There is no need for a basic gear rack to define the gear tooth profile. Two involutes of one base circle—or, in case of asymmetric gears, two different base circles—the arc distance between them and the tooth tip circle describe the gear tooth (see Fig. 1 A-B, Fig. 1 C-D) and the equally spaced teeth form the gear. The fillet between teeth is not in contact with the mating gear teeth. This portion of the tooth profile is critical, however, because this is the area of maximum bending stress concentration.

In a wind turbine gearbox the tooth load on one drive flank is significantly higher and is applied for longer periods of time than for the opposite coast one. An asymmetric tooth shape reflects this functional difference. The design intent of asymmetric gear teeth is to improve performance of the primary drive profiles at the expense of the performance for the opposite coast profiles. The coast profiles are unloaded or lightly loaded during relatively short work period. Asymmetric tooth profiles also make it possible to simultaneously increase the contact ratio and operating pressure angle beyond conventional gear limits. The main advantage of asymmetric gears is contact stress reduction on the drive flanks, resulting in higher torque density, or load capacity per gear size. Another important advantage is the possibility to design the coast flanks and fillet independently from the drive flanks, managing tooth stiffness and load sharing while keeping a desirable pressure angle and contact ratio on the drive profiles. This allows reducing gear noise and vibration level. Asymmetric gears make it possible to simultaneously increase the transverse contact ratio and operating pressure angle far beyond conventional gear limits [2].

Tooth Fillet Profile Optimization
The tooth fillet design begins when the involute flank parameters are completely defined. The initial fillet profile is a trajectory of the mating gear tooth tip in the tight, zero-backlash mesh. The fillet optimization process [3] utilizes three methods: random search method locating fillet points; trigonometric functions for fillet profile approximation; and FEA for stress calculation.

The first and the last fillet profile points of the initial fillet profile lay on the form diameter circles (Fig. 2A, Fig. 2B) and can’t be moved during an optimization process. The random search method is used to move the fillet finite element nodes along the beams that connect the fillet center and the nodes of the initial fillet profile.

The bending stresses are calculated for every new fillet profile points’ combination. If the maximum bending stress is reduced, the program continues searching in the same direction. If not, it steps back and starts searching in a different direction. After the given number of iteration steps the optimization process is stopped, resulting in the optimized fillet profile that provides minimum bending stress concentration. Table 1 illustrates fillet profile optimization and the achievable maximum bending stress reduction for standard AGMA 201.2 gears.

The 20-25 percent bending stress reduction provided by the fillet profile optimization can be used directly to increase the tooth bending strength if it limits the gear drive load capacity. However, the gear drive load capacity and its size and weight are typically defined by the contact stress, or tooth surface durability. In this case the benefit of the bending stress reduction can be converted to reduce the contact stress and simultaneously increase gear mesh efficiency [4]. This is possible by increasing the number of teeth and applying the finer diametral pitch (lesser module) for the teeth with optimized filler, keeping the given center distance.

Table 2 presents a comparison of the traditionally designed gear pair with the 27-tooth pinion and the 49-tooth gear, the 3 mm module, and the 32 and 30 mm face widths for the pinion and gear accordingly with similar gear pairs created by Direct Gear Design with the symmetric and asymmetric tooth profiles. This table illustrates the contact and bending stress reduction and increased mesh efficiency for direct design gears. Fig. 3 presents the carrier assembly of a two-stage planetary turboprop engine [5]. Application of asymmetric gears allowed significant weight-output torque reduction in comparison with similar gearboxes with conventional symmetric gears.

Optimized gear profiles require custom tooling. For profile machining process (Fig. 4) the tool profile is the same as a space profile between the neighboring teeth. For generating machining process like gear hobbing (Fig. 4) the tool profile is defined by reverse generation when the designed gear forms the tooling rack profile. In this case the rack profile (pressure) angles are selected to provide the best machining conditions.

Summary
Unlike traditional gear design, which is based on the rack generating process and driven by manufacturing convenience, Direct Gear Design is driven entirely by application requirements, when technical and market performance of product is critical. It provides the ultimate in optimized gear geometry solutions for custom gear transmissions such as wind turbine gearboxes. The benefits of this approach include higher load capacity, reduced size and weight, extended lifetime, reduced noise and vibration, higher efficiency and reliability, and reduced cost. AKGears has implemented direct gear design in many high-performance gear drives, and we welcome your inquiries. 

References:
1) E.B. Vulgakov, Gears with Improved Characteristics, Mashinostroenie, Moscow, 1974 (in Russian).
2) A.L. Kapelevich, “Geometry and design of involute spur gears with asymmetric teeth”, Mechanism and Machine Theory, 2000, Issue 35, pp. 117-130.
3) A.L. Kapelevich, Y.V. Shekhtman, Tooth Fillet Profile Optimization for Gears with Symmetric and Asymmetric Teeth, AGMA Fall Technical Meeting, San Antonio, Texas, October 12-14, 2008, (08FTM06).
4) A.L. Kapelevich. Direct Design for High-Performance Gear Transmissions, Gear Solutions, December 2008, 22-31.
5) A.S. Novikov, A.G. Paikin, V.L. Dorofeyev, V.M. Ananiev, A.L. Kapelevich, Application of Gears with Asymmetric Teeth in Turboprop Engine Gearbox, Gear Technology, January/February 2008, 60-65.

A Strategic Approach to Successful O&M

0

It’s a fact of life that all electromechanical components will fail at some point. Having the right strategy in place to manage that failure can be the difference between success and… well, failure. This is especially true for wind turbine owners and operators. Without an effective strategy at the ready failure can be devastatingly expensive in terms of lost output, time, and most importantly, revenue.

Do you have a coherent strategy in place when failure strikes? When a problem arises, finding a fast and cost-effective solution is vital. Can the part be repaired? Does it need to be replaced? Is there inventory available? There is also a strong environmental argument in reusing existing parts instead of scrapping them and buying new.

Expanding Too Fast?
The rapid expansion of wind energy in the last 20 years has often resulted in a rush to get new technologies to market, and this has inevitably led to reliability issues. These issues can directly affect a wind farm’s revenue stream through downtime, plus there is a cost associated with additional operations and maintenance events. Some of these new technologies have a propensity for a higher failure rate within the control systems and power electronics compared with other components within the system. Approximately 54 percent of all wind turbine malfunctions are due to failures within the control electronics, electrical systems, and sensors. Unlike many of the mechanical components in a wind turbine, the majority of the electronics/electrical systems only have a single supply source—the OEM. Since the parts generally have a high unit cost, the cost of a new replacement part can be as much as three times that of repairing an existing part. In addition, gaps in the supply chain can result in exceedingly long and costly lead times.

Obstacles and Opportunities
As our industry continues to mature, many wind turbines are now coming out of their manufacturers warranty period. Numerous owners and operators throughout the United States and Europe have already experienced that some parts in their wind turbines have become obsolete, and there is no accompanying documentation to support their repair. Now if one of these parts malfunctions it is no longer just a case of replacing it, and engineers must find out how the part works and carry out detailed root cause analysis of why it failed. The complex electronics contained in today’s wind turbine assemblies requires a unique combination of skills and repair capabilities. The repair process must be carefully managed to ensure that the parts are repaired within appropriate time scales and in a cost-effective manner. This involves the use of detailed workflow and quality procedures so that each stage in the repair process is monitored and certified according to ISO standards. Fig. 1

Often the most difficult part of this repair process/recertification involves ensuring that parts are exercised to their full design specifications. The majority of electronic control parts are custom made for the wind turbine environment, therefore it is not practical or reliable to test these parts using standard off-the-shelf equipment. Nor is it practical to use a wind turbine to exercise the parts. This situation has necessitated the development of complex new software, tooling, and test jigs in order to carry out full testing and validation procedures. To replicate an often highly intelligent series of electronic interfaces and inputs/outputs signals need to be analyzed in great detail, and software and hardware emulation techniques are used to design tooling equipment capable of ensuring full test coverage on all areas of functionality of the parts. Finding a depot repair facility with expertise in this arena can be difficult, but not impossible. At DEX, for instance, we have facilities in the U.S. and Europe already in full operation. At every stage in the repair or refurbishment process it is crucial that the highest quality assurance standards are adhered to, and that a full audit trail can be provided showing the progress of the repair and certifying that the quality standards are in full compliance.

In all, a holistic engineering solution is necessary to report failure symptom trends, epidemic failures, third party module issues, and evidence of design quality and reliability problems. Understanding the “why” and “how” of component failures is paramount to prevent future disruptions in production.

Proactive Solutions
To maximize efficiency and effectiveness in this new environment, a coherent multi-faceted solution strategy must be in place before failure strikes. Specifically the need for a component repair or replacement strategy, asset management strategy, and an inventory management system need to be addressed proactively. Fig. 2

A coherent asset management strategy will mean that repairs are carried out quickly and efficiently, minimizing downtime. Once a part becomes defective it should be swapped out and sent out immediately for repair to ensure that a stock of working components are always available. Parts pooling schemes between operators can also help ensure that contingency stocks are kept high. The location, storage, and transportation of spare parts are crucial. Our research and experience has found that parts are frequently stored in warehouses close to the wind turbine site without adequate protection from the elements and are often in poor condition due to the adverse environment. In many cases the parts are unusable and need to be refurbished or repaired before they can be fitted. This can be avoided by storing parts in a central location under strictly controlled environmental conditions. Sensitive electronics are particularly vulnerable to temperature changes, humidity, and so forth, and can rapidly deteriorate if not stored properly.

Being able to track spare parts is equally important. Having an efficient asset management system with 24/7 visibility of where all parts are located and their condition—good inventory, WIP/defective—can save valuable time by identifying where spare part deficiencies may occur. DEX has developed a unique Web portal that clients can use to track and monitor their inventory providing them with real-time status of their operation. Fig. 3

Case Study
To help illustrate the necessity of having a comprehensive strategy in place I’d like to share what occurred with one of our clients. A major European wind farm operator whose turbines had come out of the warranty period had a series of rotor current controller parts failures, significantly reducing their production. With no advance strategy in place they simply turned to the OEM to purchase replacement parts. To their shock they learned that the lead time for their replacement parts was three to six months. In addition, the pricing structure from the OEM was going to significantly increase their costs. Compounding a worsening situation, with their reduced production the wind farmer was forced to purchase additional power from the grid to meet contractual obligations. Production loss on these turbines alone was in excess of five months, costing them an estimated $370,000. Not surprisingly, they began searching for alternative solutions to resolve this situation and alleviate any reoccurrences in the future.
Fig. 4

With the wind farmer turning to our company, our DEX engineering team evaluated the defective parts and developed a full test and repair solution for the entire rotor current controller systems. A proprietary diagnostic software package was developed to ensure test reliability and repeatability during the product test phase. Upgrades were also carried out on the turbines, dramatically improving overall reliability. As a result the turbines were brought back online to a position of full production resolving their immediate need, and their material cost was reduced by a factor of three. A comprehensive solution has been set in place to prevent a repeat of long-term outages and disruptions in production.

In these challenging times wind turbine operators need to utilize any and all opportunities for maintaining the output of the operation at its highest capacity, cutting costs, and maximizing revenue and profits. Having a comprehensive strategy in place before failures occur is critical. Having the proper component repair or replacement strategy, asset management strategy, and an inventory management system in place can make a major contribution to achieving these goals. 

Maximizing Grid-Connect Time

Nearly all utility-scale wind farm management systems have state of the art automatically controlled wind turbines, but at the electric grid intertie the substation is often managed manually. Some substations may have remote control capabilities, to be sure, but they are still completely manually controlled and require operator intervention for restoration. The real irony is that the cost to implement a full auto-restoration scheme at a modern substation with intelligent electronic protection devices is likely to cost no more than the lost revenue of one extended substation outage, and so it’s truly being “pennywise and pound foolish” to avoid implementation of such a system.

The modern wind farm grid intertie substation uses what is termed as intelligent electronic devices, or “IEDs.” An IED is any microprocessor-based unit that receives voltage, current, status, or other data from sensors and other devices and can issue commands via hardwire contacts or communication ports based upon internal programmed setpoints and logic. Substation IEDs are typically a variety of digital relays, digital logic processors, communication processors, and real-time controllers. The signals from inputs are interpreted in a systematic and predetermined way so that the system power devices are energized, de-energized, or otherwise controlled appropriately. The digitized analog values, status bits, timing functions, and logic functions that are integral elements of the substation IEDs can be leveraged to add auto-restoration capability to the substation. Although few if any IEDs must be added to perform auto-restoration, there is necessary effort to program the IEDs for auto-restoration. Standardization of the IED schemes minimizes the effort to programming, test, and commission the IEDs, and therefore the cost to implement auto-restoration. A simplified distributed wind generation substation diagram is shown in Fig .1.

A manually restored substation will have the protection relays indicated on the left side of fig. 2 under the heading “basic.” The scheme status switches are feedback indicating the system status of breakers and relays, etc. The relay IED scheme buttons are manually actuated locally or remotely to set the scheme into the desired mode. An auto-restoration may then be initiated manually using proper timing and the devices on the “basic” side of the diagram. A substation is fully automated by the addition of the microprocessor-based logic processor IED indicated on the right side of Fig. 2 under the heading “advanced.” The logic processor IED communicates with the substation relay IEDs to determine the status of all the power devices in the substation, and then upon pre-programmed logic stored in the memory of the logic processor IED the auto-restoration will be executed automatically at the appropriate time using measured data rather than timing to restore the substation.

The restoration sequence for a fully automated wind project follows the state flow diagram in Fig. 3. The normal state in which turbines are generating and providing electrical energy to the utility grid is the “normal” state at the top right of the diagram. When there is line fault or system disturbance the EPS breaker (breaker “U2” in Fig .1) will open and the system changes to the “EPS disconnected” state. The flow of energy to the grid ceases and electrical energy is no longer marketable. During the transition to the next state, two timed sequences are activated simultaneously. First a “power fail trip” status (labeled “PF trip” in Fig. 3) is declared three or more seconds after the loss of three-phase voltage. All relays for the line, feeder, and capacitor breakers are programmed with this status and all line, feeder, and capacitor breakers are opened at this time. The EPS breaker will close after the utility has cleared the fault or disturbance and the power fail trip operations have completed. The system state is now “ready for restoration.” The line breaker (breaker “U1” in Fig .1) will close if the appropriate conditions are all true after a set time delay. After the line breaker is closed, the feeder breakers will automatically close one at a time with predetermined time delays. Typically all the feeder breakers close in 10-second intervals so that all feeders are restored within one or two minutes. Once all feeder breakers are closed the collector substation returns to the “system available for generation state.” The total outage time for a fully automated collector project—turbines and substation—is typically 10 minutes or less. Any outage time due to the loss of the utility source is minimized and therefore provides optimized generation availability.

The value of automated substation restoration can be calculated by the economic advantage of reduced outage time relative to the longer time required for manual restoration. For a typical 100 MW wind farm with 33 percent generation capacity that is connected to the utility grid 70 percent of the time, the value per hour for lost delivery to the grid when generation would otherwise have been available is $3,500 per hour at 7.5 cents per kilowatt-hour. If manual restoration requires 12 hours before restoration can be accomplished, then the total energy value for this example is $42,000. It should be noted that this represents only the economic energy advantage and does not take into account the avoided cost for labor and vehicle expenses that are incurred with manual restoration. Manual restoration cost includes accounting for the time for an operator to be notified of the outage, the operator to travel to and from the collector substation, to analyze the reason for the outage, and then perform the restoration. The savings may be less than 12 hours if the manual restoration can be accomplished in good weather when an operator is readily available, but on a weekend night in inclement weather the time for manual restoration can be one or two days. After considering all these factors it is not difficult to recoup the investment for the auto-restoration investment after only one or two line outages.

The provision for auto-restoration on distributed generation, particularly for utility-scale wind farms, has been shown to be very feasible, with the microprocesser based relays and communication processors already being used to protect the collector substation that is part of every renewable energy project. With renewable energy very much dependent upon the uptime and delivery of energy to the grid, auto-restoration provides a very good way to accelerate the return on the large capital investment required for renewable generation. With only a marginal investment, the addition of auto-restoration may pay for itself in as few as one or two outages.  

A New Phase in Turbine Condition Monitoring

0

Since 2001, M4 Engineering and M4 Wind Services have been offering engineering, manufacturing, monitoring, data analysis, quality control, and maintenance services to the wind industry. Since this qualifies M4 as a broad-based support company, M4 was selected by turbine manufacturers and owner/operators to conduct extensive turbine health studies at various operational sites across the United States. For over two years evaluation points have been measured using accelerometers, strain gauges, thermocouples, and lasers. Reams of data have been collected and analyzed, yielding a starting discovery: the clearest and earliest health indications came from the bending and azimuth measuring devices attached to the main rotor shaft. All other measurements indicated that a problem had already occurred. Measuring the bending moments and torsion loads of the shaft allowed for operational adjustments and general maintenance to be conducted that relieved these stresses on the turbine, preventing equipment problems and extending component life, minimizing unscheduled downtime, and increasing power generation. Hence, Rotor Redline was born.

What is Rotor Redline?

The Rotor Redline system, patent pending, is a completely vertically integrated data acquisition, transmission, reception, conversion, collection, and analysis system that evaluates main shaft loads as a precursor to equipment degradation and an indicator of inefficient wind-to-rotor alignment. State of the art electronics are paired with standard measuring techniques to provide the lowest-cost approach to condition monitoring available in the industry today. Real-time system information is analyzed and translated into executable actions for the end user to perform well in advance of equipment deterioration. Fig. 1 graphically represents the early detection of Rotor Redline, as compared to other industry methods.

Bending and azimuth measuring devices are directly attached to the main shaft to measure moments and torsion loads in a shaft-fixed coordinate system. Rotor azimuth angle is also measured, which allows the load data to be automatically transformed into a nacelle-fixed coordinate system. This information is then transferred wirelessly via the Ethernet cabling installed within the tower. These communications between all of the system’s components utilize the Zigbee Mesh Network protocol that allows for each Rotor Redline to act as its own router, eliminating the need for an on-site network receiver if tower Ethernet is available or allowing for a single network receiver to be installed for any size wind farm, regardless of acreage.

As the load data is received at M4 it is automatically analyzed, taking away the need for data stream interpretation. Abnormal loads are diagnosed for root-cause determination and the corrective action required. These actions are then transmitted to the operator to make control adjustments and schedule/dispatch maintenance personnel. If M4 is responsible for maintenance, personnel are already in route to the site if a critical alert has been generated. In addition, all data is accessible to the customer, and specific comparative data can be downloaded in real time for review and analysis. Fig. 2 provides a simplified overview of the Rotor Redline system.

The Prevailing Winds and Rotor Alignment

Before a turbine is located on a site, tremendous effort is made to determine the best placement and best orientation of the tower to maximize power production. Once erected, anemometers are placed atop the nacelle and offset calculations are made based on their locations relevant to the prevailing winds. This is fed into a software algorithm to give directional control instructions to optimize wind power production at any given time. However, winds are inconsistent and non-uniform, and the calculations are based on averages, hence directional control that is based solely on anemometer readings may have a built in inefficiency of 3-10 percent. Assets believed to be operating at 90-98 percent efficiency are actually operating with rotor-wind misalignment, and revenue is being lost. Rotor Redline fine-tunes your system and allows for recovery of this lost revenue.

For example, the data analysis indicates that the shaft is consistently bending into one direction, and the root cause is identified as yaw misalignment. The action alert sent to the operator would be to adjust the turbine X degrees in the Y/Z direction to reduce the loads and optimize power production. The inefficiency is relieved and maximum revenue generation is obtained, with the side benefit of relieving the bending moments that transmitted negative stresses throughout the turbine system. No induced stresses and strains on components means less degradation and unscheduled downtime for replacing failed parts (see Fig. 3, Fig. 4, Fig. 5).

As noted previously, wind patterns are inconsistent and non-uniform. However, the stresses and strains produced by these winds are shown in consistent patterns. Higher lifts indicate non-uniform aerodynamic imbalances from varying wind speeds. Turbulence is shown as random components of rotor loads. Lower lift tells you that excessive wind shears are present. All creating induced loads that can be offset by operational adjustments. Fig. 6 outlines the Rotor Redline remediation process in relation to directional adjustments and maintenance notifications.

Equipment and Downtime

The prevailing monitoring systems used in wind turbines today are vibration/acoustics controlled for the turbine and optical strain gauged for the blades. In acoustics the noise frequencies of pristine components are loaded into the system, and alerts are given when the sound signature strays out of a certain threshold range. This is an effective and recommended method of determining when a downstream component has already degraded, but it does not give an operator executable actions to perform that may keep that deterioration from occurring. Net result: predictive and reactionary maintenance versus the preventative maintenance of Rotor Redline. (For more information on vibration monitoring equipment see the May/June 2009 edition of this magazine, available online.)

For determining turbine blade health, optical gauges are molded into the blades during manufacture or fitted in the field. A disruption in the optical light path along this gauge indicates that there is an issue and the blade must be inspected for possible repairs. This is effective as long as the damage has occurred along the optical gauge. If damage occurs elsewhere, or if the field-fitted gauge has lost its installation integrity, no damage readings or false damage readings are given. In addition, the optical strain gauge does not give any indication of stresses being introduced to the turbine system, so gearbox—and possibly generator—degradation are occurring. Net result: inconsistent health information versus the consistent feedback of Rotor Redline.

In the previous situational example, rotor-wind misalignment was calculated and fine-tuning of the directional controls was made to improve operational performance. However, Rotor Redline is detecting other anomalies that can be used to also improve operational availability. For example, the data shows a non-uniform load each revolution at the same rotor position regardless of wind direction or strength. The fault determination is a mass imbalance in one of the turbine blades. Inspection and correction is required which will relieve stress on the system and prevent damage to the gears. An action alert is sent to the operator, and a team is dispatched to correct the problem.

An example of a downstream detection could be that there is a constant load peak being applied at the same rotation of the main gear. The fault indication is that there is an excessive buildup of dirt in the lubrication fluid, requiring fluid and filter change plus gear cleaning. This general maintenance notification again relieves the strain on the main drive system and prevents transmission of stresses throughout the turbine. Deterioration due to abnormal loads is prevented, and downtime due to unscheduled maintenance and part failures are avoided.

Determining Remaining Equipment Life

Other than the obvious benefits of being able to fine-tune rotor to wind alignment, schedule maintenance well in advance of component deterioration, or dispatch emergency work crews as soon as critical anomalies are detected, there is a another major benefit to Rotor Redline: real-time life expectancy can be determined for the major components of your turbine.

All manufactured parts have a designed-in fatigue life. Wear and tear during operation and induced stresses and strains are translated into fatigue loads. As more loads are induced, parts wear down and eventually fail (Fig. 7). Given the design characteristics of the component and its fatigue life, M4 engineers can evaluate the condition of these components at the time of Rotor Redline installation. This will establish the baseline condition of the equipment and its operation life remaining. As load data is then acquired, the Rotor Redline system calculates the fatigue loads applied to each component and updates their real-time life remaining.

Operators are now able to know when major components are going to fail and can plan accordingly. Gone are the days of an asset sitting idle as the replacement part is on backorder, or has a long manufacturing lead time. Cash is not tied up in replacement parts that are not yet needed and parts are no longer failing unexpectedly, causing severe damage or failures of other turbine components. As the operator you are now fully in control of your maintenance, replacement, and refurbishment schedules.

Return on Investment

So the Rotor Redline technology sounds good, but what’s the payback? While there are too many variables involved from site to site to make guarantees, we can estimate a maximum ROI of about eight months due to improved power generation, better wind/turbine alignment, and reduced equipment wear and replacement. How? Consider the following.

As presented at a recent AWEA conference, every 1 percent increase in efficiency or asset availability, and every $10K per tower of annual maintenance savings, has a net present value of almost $8,000,000 to the typical 100MW wind farmer. Also, every 1 percent improvement in output and every degree of corrected misalignment result in more than $30K per year per turbine in added revenue. So even the slightest improvement results in a rapid ROI and long-term increased revenue.

Summary
M4’s Rotor Redline system allows an operator to monitor all aspects of their turbine’s performance. Operational adjustments can be made that minimize downtime, extend component life, and maximize power generation. Major maintenance and repairs can be deferred or avoided, advance plans for even long-lead items can be made, and parts can be acquired as a safety net. Additional sensing components can be added, or Rotor Redline can be tied into existing up-tower equipment to provide notification of equipment deterioration. Wind-to-Rotor alignment adjustments can be made to optimize power production and relieve stresses on all of the system components, further reducing downtime and maintenance costs. Rotor Redline truly brings directional control, equipment life, equipment maintenance, and peak performance into one condition monitoring system, providing the wind farmer with operational flexibility and control of their asset’s life. 

Optimizing Existing Wind Towers

0

As the telecommunication industry matures, many existing towers are being structurally optimized to improve their load carrying potential for additional antennas. Public opposition and zoning restrictions have limited the number of towers that can be built, forcing tower owners and carriers to collocate new antennas on existing structures. Towers that were originally designed for one set of antennas are frequently being structurally upgraded to handle additional microwave dishes, radios, and other equipment to increase coverage to the growing population that uses cellular technology. Collocating this equipment significantly improves the revenue potential for the tower owner, providing further incentive to structurally modify a tower to handle new loadings. In certain environments towers are also susceptible to corrosion fatigue, which lowers the structural capacity and oftentimes creates safety concerns. Tower reinforcing options also exist to remedy corrosion and reinstate the structural integrity of the tower. To further optimize the towers’ value, owners also have the option of extending the tower height to improve cell coverage and increase the vertical real estate available for lease. This approach is very attractive to tower owners as an alternative to building a new site.

Fig. 1

Just as the telecommunication industry has adopted these optimization practices, the wind tower industry is also facing similar challenges as the need to place larger turbines on existing structures surfaces and the towers degrade.

Structural Modifications
To modify a structure to carry additional loading or remedy a corrosion issue, many owners are reinforcing their towers with bolt-on structural steel members, welded reinforcements, clamp-on sleeves, or carbon fiber reinforcing. The added strength provided by the reinforcing enables the tower to support heavier loading or offset material losses from corrosion. Strengthening a structure can be challenging from design, fabrication, and installation standpoints:

• Design—Reinforcing challenges include accounting for correct tensile and buckling capacities in the proposed members, developing the loads in the end connections, and utilizing connections that can adequately transfer loads between the reinforcing elements and tower. Selection of proper reinforcing elements to expedite the installation and decrease equipment downtime is critical.
• Fabrication—Strict QA/QC procedures must be in place with the fabricator to ensure all products are fabricated to the correct design requirements. Galvanizing or other surface protection must be used to prevent long-term corrosion in the upgrade components.
• Field Constructability—Installing reinforcing elements in the field requires a competent climbing crew and strict attention to safety and quality. The reinforcing design and connection details contribute to the constructability, with bolted and adhered solutions preferred over welding to eliminate onsite fire hazards and quality control concerns. Welding may also damage galvanizing on interior pole surfaces in a way that is challenging to access and repair, accelerating future corrosion.

Reinforcing Types
Towers can be classified into three different categories: monopoles, self-supporting towers, and guyed towers. Monopoles are generally used for cell sites located in urban areas and large wind turbines. The steel tubular structures are typically fabricated using customized geometry and high strength steel plate not readily available for aftermarket modifications. Common reinforcing systems for monopoles include both bolted and welded structural steel members connected to the exterior of the pole shaft. Flat plate, bent plate, and structural channels are common choices, with structural channel providing the best value due to higher structural efficiency than flat plat. Pole-MaxTM, a monopole reinforcing product line manufactured by Aero Solutions, is a high strength channel widely used in the telecom market for this purpose. The high strength, galvanized steel channels are bolted to the monopole shaft wall with shear transferring blind bolts. The high capacity blind bolts transfer shear from the reinforcing plates into the pole wall and develop the full load carrying capacity of the upgrade in the end connections. The blind bolts are installed from the outside of the structure and do not require access to the inside to facilitate installation. The bolted connections are recommended to minimize damage to the pole and reduce the risk of fire. Once installed the steel channels can provide a significant improvement in pole capacity, enabling the tower owner to install additional loading or compensate for wall loss as a result of corrosion.

Fig. 2
Self-supporting and guyed towers are lattice structures typically fabricated of solid round, tubular, or angular steel members. Self-supporting and guyed structures are more commonly used for small to medium wind applications, while it is uncommon to find these structures used in large wind applications. The towers have far more structural components than a monopole and require a different approach for reinforcing. Depending on the geometry of the tower, a bolted steel solution can be used to reinforce overstressed members, or carbon fiber composites to provide additional strength. Both solutions provide a safe alternative to welding.

Tower Extensions
Extensions enable owners to increase the revenue potential of their site while also preventing carriers from building a new tower. Extensions have become very popular in the telecom industry, specifically in densely populated areas where land is limited and permitting and zoning requirements are strict. To extend a tower the owner will be required to determine whether or not the structural capacity will allow for the new loading without requiring an upgrade. In some cases the addition of an extension will overstress the tower, requiring the owner to not only install the extension but also install a tower modification.

Extension designs exist for all three types of structures and can be developed to limit the equipment downtime and minimize the resultant loading on the existing structure. Extensions for guyed and self-supporting towers generally require a new tower section to be fabricated with a face width matching the existing tower. Common designs for monopoles extensions include the following:

• Flange to Flange Connection—A design typically requiring a new top flange to be installed on the existing structure to accept the proposed extension. The tower flange can be welded to the structure or connected with bolted brackets.
• Stilted Adapter—A design using bolted, high strength channels to extend the height of the structure.
• Mouse Hole Adapter—A variation of the flanged connection, using “mouse holes” in the new extension to bridge over existing equipment.

Relevance to Wind
As owners in the telecom industry continue to optimize their tower infrastructure, a need is evolving in the wind industry to maximize the revenue potential of existing wind turbines and ensure the continued operation of structures located in corrosive environments. The issues and opportunities faced by the cell industry over the past decade will likely be shared by the wind industry as the quantity of turbines continues to grow throughout the U.S. Steel corrosion, weld fatigue, and other long-term structural degradation will require owners to continually inspect their towers and be prepared for potential modifications.

Fig. 3

Extending existing wind towers will enable owners to place larger, more-efficient turbines on preexisting structures. As wind turbine technology evolves, wind turbine owners can allow their tower portfolios to evolve in tandem by extending the structures when needed to allow for larger turbine loading and blade spans. 

Note: The author is a member of the U.S. Wind Energy Structures Group, which is a recently formed consortium of the ASCE Wind Structures Committee, National Renewable Energy Lab, and the American Wind Energy Association (AWEA). Aero Solutions is also represented on the TIA (Telecommunications Industry Association) TR14.7 committee, a group that focuses on standards for telecommunication towers.

Conquering Turbine Shaft Alignment

0

The world’s first electric power generating wind turbine was manufactured by Charles Brush in 1888, and it delivered 12 kW of power reliably for 20 years (Fig. 1). The battle to make wind energy economically viable has been going on ever since, and it must be fought on many fronts. One key element in the struggle for increased reliability and efficiency is achieving excellent shaft alignment of the wind turbine generator train. Is this an uphill battle for you?

The Challenges

Many challenges face the wind turbine operator and alignment technician in achieving the goal of having in-tolerance alignment under operating conditions. A good laser alignment system with the correct feature set is an essential weapon in your arsenal to win this war.

One concern involves compliance with safety regulations. In the United States, several states do not permit the presence of a person in the nacelle when the blades are turning, yet to perform the alignment it is necessary to turn the shafts. In these cases a special safety exemption must be obtained, or if your laser alignment system allows it, accurate readings can be taken without the need to rotate the blades by more than the clearance allowed by the blades’ safety tether. Because of the enormous input to output ratio of the gearbox, at a normal operating input speed of 20 RPM to an output speed of 1800 RPM, the turbine blades would only need to be rotated 1 degree to achieve a 90-degree rotation of the gearbox’s output shaft. The best laser systems allow you to collect accurate and repeatable alignment readings with as little as 70 degrees of shaft rotation, starting anywhere and stopping anywhere. Moreover, this safety requirement in turn demands that your laser system have the ability to take readings automatically and continuously over this small angle of rotation so that enough data can be collected to be statistically meaningful. More importantly, it must allow the shafts to be rotated in either direction, particularly if the turbine blades are tethered or if the law does not permit a full rotation of the turbine with the technician present in the nacelle.

Another concern is that, in those types of turbines where stopping rotation by applying the brakes can itself affect the alignment, due to the flexibility of the anchoring structures, a true continuous sweep measurement mode is essential so that readings can be automatically collected while the shaft is in motion. This eliminates the need to have to stop the rotation by engaging the brake to take measurement points that may otherwise be influenced by this external force acting on the rotor. In these cases simply allowing the tether to stop the rotation is of benefit, as enough unloaded data will be collected before the tether stops the shafts.

Once in the nacelle, lack of space is a major concern. Very often the technician is only able to access the machines from one side. Does your laser system allow you to switch the viewpoint of the machine train? Does it let you move the generator into alignment with the gearbox even if you have to place it at the left end of the machine train on your alignment computer’s screen?

Not least of the challenges facing the alignment technician is ascending the turbine mast to the nacelle with the equipment necessary to perform the alignment. Unless the technician is athletically inclined and believes he or she can arrive at the nacelle with enough energy left to do the job (Fig. 2), valuable crane or helicopter time must be scheduled (Fig. 3). Thus, careful planning is needed to keep costs from escalating out of control.

Obtaining correct target specifications for a good alignment under running conditions to feed into your laser system is extremely important. Wind turbines are notoriously flexible structures. Thus, changes in wind speed and direction, generator load, and temperature can have a very significant effect on the shaft alignment between the gearbox and generator. A good quality coupling is essential to withstand these variations but does not excuse a poor alignment, because although the coupling may be able to take it, the bearings and the gearbox won’t. Excessive vibration and the resulting radial and axial loading on the rotating components will decrease efficiency and shorten operating life drastically. Therefore, your laser system must be able to handle target specs so that you can compensate for the positional changes that occur between the stopped (unloaded) condition at time of alignment and the running condition. One system successfully tested for monitoring positional change in the turbine generator train is Permalign®. An extensive study performed by Pruftechnik and Nordex in Germany demonstrated its viability. Immensely valuable data was collected that permitted the generator and gearbox to be misaligned in such a way that they would grow into alignment with each other under average operating conditions (Fig. 4). Vibration was significantly reduced, and operating efficiency and longevity increased.

The Alignment

Mounting your brackets can be a challenge in tight spaces. Does your system offer compact magnetic brackets with offset adapters as well as chain brackets? In Fig. 5the laser emitter is mounted on a magnetic bracket with offset adapters directly to the brake disc on the gearbox output shaft, behind the flex plate of the fiber spool piece coupling. The disc brake mechanism impedes a full rotation of the shafts.

The vertical adjustment of the gearbox is usually undertaken with hydraulic jacks or with conical counter-rotating adjustment pads, rather than with shims (Fig. 6). This requires your laser system to be able to simultaneously monitor vertical and horizontal moves, in real time.

Another critically important feature your laser system should possess is “standard deviation.” Since time is of the essence and shaft rotation may be limited, it is very important for the technician to be able to assess the quality of his or her readings immediately, while simultaneously eliminating needless repeatability checks. The ability to individually disable aberrant measurement points within a set of readings is imperative. For a greater understanding of the subject of measurement quality and standard deviation in shaft alignment readings, we refer the reader to a PowerPoint presentation, as well as an article on turbine alignment, which can be found on LUDECAwind’s Web site, listed at the end of this article.

Only the best laser alignment systems unite all of the necessary features and functionality required to perform accurate and timely wind turbine shaft alignment. This is one critical aspect of wind turbine maintenance where skimping with a cheap laser system will cost you dearly. Buying the right system pays off immediately in labor savings, operational efficiency and, crucially, in unnecessary repairs and their concomitant unscheduled downtime.

The Future of Wind Turbine Diagnostics

0

Wind energy is undergoing expansion, and it is bound to grow to a commercial/consumer level in the decades to come. This growth has materialized in the form of large-scale wind farms, wind energy cooperatives, wind turbines owned by individual investors, and multinational exploration of remote sites and offshore locations. Despite the increasing rated capacity of wind turbines, operation and maintenance (O&M) costs remain high due to failures of wind turbine components such as gearboxes and blades. To make matters worse, in spite of several drawbacks associated with current/traditional maintenance practices, almost all industries are still following them. Thus, there is a great need to educate managers of such firms about the economic justification of performance monitoring in the wind industry, which is currently characterized by high maintenance costs.

The SCADA system installed at each wind turbine contains information about various turbine parameters, including all kinds of errors encountered by the system. Knowledge of wind turbine parameters and their impact on turbine components can be used in planning cost-effective maintenance activities [1-3]. Currently, with the availability and use of SCADA data, and hence the accessibility of a vast amount of historical data, the first step of cost-effective maintenance—e.g., the knowledge of past parameters of wind turbines—is relatively easy. By extracting the knowledge from this data, money can be saved by predicting and evaluating the faults of turbines and correctly maintaining the system without performing a manual inspection of each turbine.

Turbine Characteristics

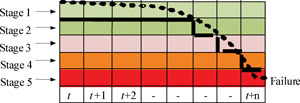
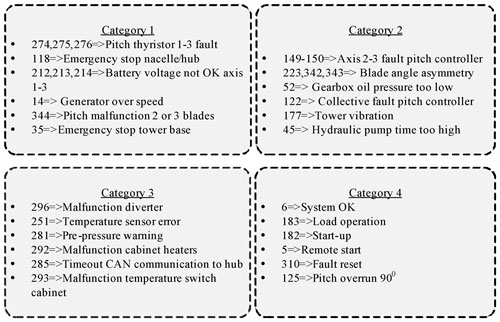
A wind turbine includes assemblies, systems, and components that may fail [4]. A component failure usually develops in stages over a period of time (Fig. 1). Performance of turbine components can be determined by examining changes in turbine parameter values, reported as status codes. For a typical large-scale turbine (e.g., 1.5 MW, 2.5 MW) over 400 different status codes can be generated. A status indicates a potential emerging fault. Pitch malfunction, blade angle asymmetry, and pitch thyristor faults are typical statuses generated by a wind turbine. Depending on the severity of the problem, status codes are divided into four categories: category 1 is the most severe, and category 4 usually represents an inconsequential event (Fig. 2). The sequential occurrence of category 1 through category 3 statuses may represent a fault in the component. An illustration of some of the statuses vis-à-vis turbine components is shown in Fig. 3. On average more than 4 status codes can be generated for specific components, and therefore finding a relationship between such statuses will be helpful for monitoring purposes.

Pattern Identification

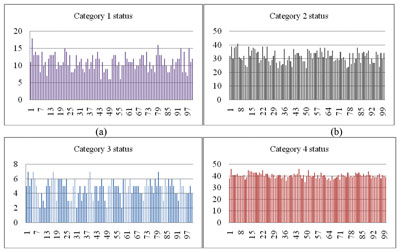
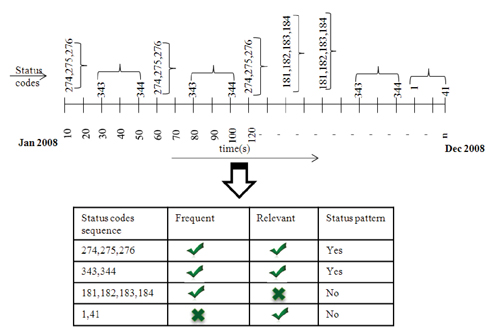
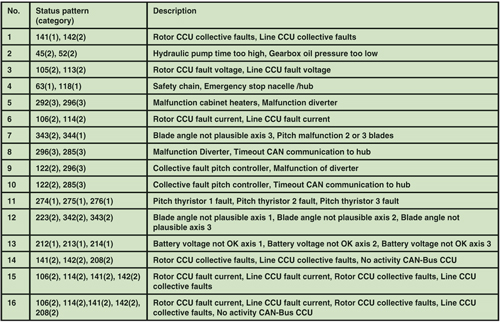
There are various ways historical data can be used to monitor the performance of wind turbines. Data mining provides an easy yet robust approach to performance monitoring. In this article data-mining techniques are discussed in order to find useful information/patterns from turbine data. In one experiment historical data of 100 turbines over a period of one year (Jan.-Dec. 2008) is used to identify the status patterns. The histograms of statuses in category 1 through category 4 for 100 turbines are presented in Fig. 4. The yearly data is converted into a 10-second time period, and any status codes recorded within 60 seconds are considered as the possible status pattern. The category of the status pattern considers only relevant status patterns (e.g., categories 1-3). A sample illustration is given in Fig. 5. Statuses recorded at the same time (e.g., 274, 275, 276) correspond to the same component, whereas statuses recorded within a maximum allowable time delay (e.g., 343, 344) can be related to two or more components/subcomponents of the wind turbine. After sorting out irrelevant and infrequent status patterns, a total of 16 different status patterns (e.g., 16 emerging faults) in all 100 turbines were found (Table 1 and Fig. 6). It is obvious that not all the faults need maintenance, as minor faults can be corrected by resetting the turbine; however, for major faults on-site maintenance is required. Therefore, 10 representative turbines out of 100 were selected to determine the frequent status patterns.

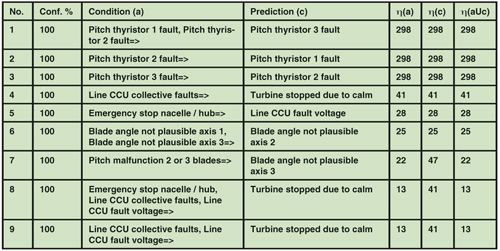
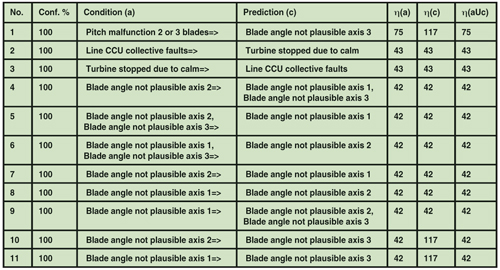
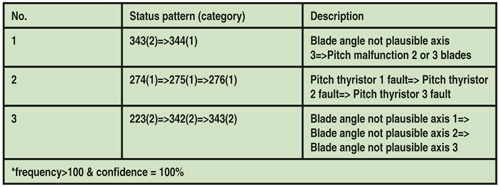
Mining data of 10 representative turbines provides a list of the frequent status patterns in the form of an if-then-else rule. Criteria for selecting status patterns are based upon: (1) status pattern frequency and; (2) status pattern strength. The strength of a status pattern can be understood by the uniqueness of individual statuses in predicting a status pattern. A status pattern with 100-percent confidence ensures that the status pattern is unique. Table 2and Table 3 provide a list of frequent status patterns of two different turbines. Status pattern no. 1 in Table 2> indicates that the fault in pitch thyristor 3 happen (100 percent of the time), whenever faults in pitch thyristor 1 and 2 occur. The notation η(a), η(c), and η(aUc) is used to represent the frequency of condition (a), prediction (c), and the combined frequency of both condition and prediction, which forms a status pattern. Similarly, status pattern no. 8 in Table 2 indicates that out of the 41 times when the turbine stopped due to calm conditions, 13 times were due to an emergency stop in nacelle and line CCU faults. It also indicates that an emergency stop in the nacelle/hub along with line CCU faults (both collective and voltage based) always resulted in turbine stoppage. Overall, a total of 10 different lists were obtained, and the three most frequent status patterns were identified, which were common to all 10 turbines (Table 4). All three frequent status patterns are unique and appeared more than 100 times in a year. The results in Table 4 indicate that the turbine blades are more prone to damage.

Data Mining-Based Performance

The experiment conducted affirms one of the various ways in which historical turbine data can be used to monitor the performance of a wind turbine. The appropriate selection of process parameters from historical turbine data can be used for fault prognosis [5]. Data mining provides an easy yet robust approach to performance monitoring, which can save time and money. The efficacy and usefulness of data-mining techniques discussed here have an empirical background, and so getting useful information/patterns from the turbine data is a promising tool for performance monitoring.

Acknowledgment:

The research reported in this article has been sponsored by the Iowa Energy Center, Grant #IEC 07-01.

References:

1) P.N., Tan, M., Steinbach, and V. Kumar. Introduction to Data Mining. Pearson Education/Addison Wesley, Boston, 2006.
2) A. Zaher, S.D., McArthur and D.G.Infield. Online wind turbine fault detection through automated SCADA data analysis. Wind Energy, Vol. 12, pp. 574-593, 2009.
3) A. Kusiak, W. Li, and Z. Song. Dynamic Control of Wind Turbines, Renewable Energy, Vol. 35(2), pp. 456–463, 2010.
4) Z. Hameed, Y.S. Hong, Y.M. Cho, S.H. Ahn, and C.K. Song. Condition monitoring and fault detection of wind turbines and related algorithms: A review. Renewable and Sustainable energy reviews, Vol. 13, pp. 1-39, 2009.
5) P. R. J. Cambell and K. Adamson. Identification of blade vibration causes in wind turbine generators. Data Mining IV: Transaction, Information and Communication Technologies, Vol. 29, pp. 1-6, 2003.

Compaction grouting has multiple advantages

0

When the site of a planned wind tower is underlain by sufficiently dense granular soils, a mat foundation can be designed to safely support the structure. If the soils are too loose they may provide insufficient bearing capacity, result in excessive static deformation, or undergo unacceptable performance during a seismic event (liquefaction or excessive dynamic settlement). If the loose conditions are discovered prior to construction, options include bypassing the loose soils with a deep foundation or improving the existing soil conditions. Pre-construction soil improvement techniques include vibro compaction, dynamic compaction, and compaction grouting. Of these techniques, compaction grouting is the only one that can be used both pre-construction and beneath an in-place foundation.

Compaction grouting involves injection of a mortar grout to displace and densify surrounding soil. The grout is very viscous (“low-mobility”) and primarily consists of Portland cement, sand, and water. An injection pipe is either drilled or driven to the bottom of the soils requiring densification. The grout is then pumped through the pipe as it is extracted in 1-3 foot stages. As the grout is pumped into each stage it displaces and densifies the surrounding soils. The injection holes are often sequenced in primary to secondary to tertiary locations, such that soil can be confined and effectively densified. This process can be performed to achieve significant improvement, which is fully verifiable with post-treatment field testing.

In order to prepare an effective grouting program, a geotechnical engineering consultant must develop a report containing site geological history, soil engineering properties (including density, gradation, and moisture content), and the in-situ permeability of each treatment stratum. Location and information about adjacent structures and utilities are also required.

For optimum compaction grouting results the vertical stress (overburden) on the treatment stratum must provide adequate confinement, such that the grout displaces the soil horizontally rather than vertically, so as not to cause surface movement (heave). Overburden stresses greater than 1,500 psf are typically required to maximize densification. However, densification can be achieved with less overburden pressure, but production and technical limitations may exist.

When compaction grout is injected into saturated soils, pore pressure will increase due to the added volume. This increased pressure must dissipate for effective densification to take place. Therefore, the grout injection rate should be slow enough to allow pore pressure dissipation. As weaker soil strata will undergo more densification, increased grout volume is often required in these layers. Hydro-collapsible soils can usually be treated effectively by adding water during drilling prior to compaction grout injection; in this case the soil is collapsed during drilling and densified by the subsequent grouting. Thinly stratified soils can cause difficult or reduced improvement capability as grout takes preferential paths during injection. Soils that lose strength during remolding—such as saturated, fine-grained soils and sensitive clays—should be avoided. Typical treatment spacing ranges between 6-10 feet. Based on hole spacing, the anticipated grouting volume per stage can be calculated. Often, a maximum injection pressure criterion is established to prevent fracture and ground heave. Vertical stages are usually set at 2-3 foot intervals, with tighter grid spacing generally leading to better results.

Quality control measures include: 1) procedural inspection and documentation of the work activity; 2) testing to ensure proper mix design; 3) monitoring of grout injection rates, volume, and pressure, and; 4) post-treatment verification of ground improvement. When applied properly, compaction grouting can provide the necessary improvement of granular soils for many wind turbine sites, allowing for a shallow foundation system. In most cases, mat foundations constructed on improved soil will provide an economic advantage over deep foundation options.

Transporting components can affect long-term profitability

0

The owner of a newly commissioned wind project can generally expect a full return of their investment over 20 years. After all, despite the uncertainty of wind resources and future O&M costs, the project’s financial return is modeled on the life expectancy the manufacturer has designed into its turbine, providing some 158,000 MWh of power generation for a 3MW unit. How turbine components are handled during transportation to the project site, storage, and field construction can play a definite role in long-term profitability.

Although many construction-related issues are corrected soon after commissioning, more significant issues such as damaged drive trains, generator moisture ingress during shipment and storage, and improper installation can take years off of a turbine’s life. The reasons why a turbine fails to make it through its design life may be something as easily controllable as attentive quality assurance at the very beginning of the project life cycle.

Some question whether or not O&M service packages offered by OEMs are even reasonable, suggesting that the actual costs in the first five years may be significantly below the price of the packages. Since these are usually required by financial institutions as a requisite for long-term financing, owners should do all they can to extract the value of the warranty before it expires. Bringing in a qualified independent service provider (ISP) is the best option for balanced, impartial end of warranty inspection. During this inspection the ISP is able to provide an assessment of all major components, perform oil and grease analysis, review service history, and likely expose deficiencies that were incurred during construction but never corrected. Warranty period servicing issues related to proper greasing, drive train misalignment, deferred or incomplete maintenance, and quality of care will also surface during these inspections.

Electrical jumpers are often installed during construction to defeat a control parameter or fault response, allowing a commissioning crew to temporarily override a control function. These can sometimes remain in place through a warranty O&M period without correction. Likewise, component retrofits such as improved bolting, upgraded motors or pumps, and software enhancements might not be installed. Other findings include misinstalled or uninstalled components, wiring issues, safety system installation discrepancies, and inoperable turbine control features. Excessively worn or damaged components that should be replaced during normal servicing will be identified by the ISP, avoiding an otherwise missed opportunity to submit warranty claims.

The wind industry has historically experienced a large number of gearbox failures, and while gearbox and generator rebuilds are two of the most-costly maintenance items for a wind project, they do not have the highest failure rate compared to other components. In most cases the gearbox exhibits the highest downtime, and this is the real basis—rather than the failure rate—for concern among project owners. Frequent component replacements during the warranty period should be assessed by conducting a service report and parts usage review. Although the project operator may be primarily interested in replacing a failed component and getting the turbine back online, a failure always represents an opportunity for improvement. Most OEMs include failure analysis as an essential part of their continuous quality improvement process. If a proper root cause analysis was bypassed during the warranty period, the owner may have missed a valuable opportunity to determine if the failure was due to manufacturing quality, product misapplication, design error, or inappropriate design assumptions. This information would have assisted the manufacturer in determining if the problem was an isolated instance or a systemic problem that is likely to result in serial failures.

Construction and service quality are equally important to ensure the 20-year life of a project. Quality management encompasses the quality philosophy of the owner, proper quality assurance through planning and organization, quality control during construction, and final review and acceptance by an ISP. An extra dollar spent in upfront quality assurance will save many times more later on, particularly when it comes to the success of your wind project.

Wind will make up a significant portion of the clean energy portfolio

0

With another record year to the industry’s credit, wind energy deployment both worldwide and in the United States continues to show the effectiveness of policies and incentives coupled with a clean, affordable, and reliable energy supply. By the end of 2009 some 9,922 MW had been installed in the U.S. alone, for a cumulative amount of nearly 35,000 MWs. For the first time wind energy was tied with natural gas on annual installations, representing approximately 2 percent of our energy consumption. It is important to recognize that effective programs triggered by the American Recovery and Reinvestment Act (ARRA), such as loan guarantees and incentive options, played a key role in the large installation numbers during the recent economic downturn.

There are many existing and ongoing studies targeted at evaluating and calculating the feasibility of large penetrations of renewable in the future energy mix, with all studies showing that wind energy will represent a significant percentage of the clean energy portfolio. Additionally, with current administration goals—which aggressively suggest up to 10 percent renewable energy by 2012, and 25 percent by 2025—it is important to understand that in addition to clean technology viability and feasibility, a robust supply chain and manufacturing sector is imperative in meeting these goals.

With no offshore wind installations, land based utility-scale machines range from 1 to 2.5 MWs. These machines are typically installed on a 60 to 80-plus meter towers and have rotor diameters that can range between 60 and 100 meters, depending on the turbine rating and the wind speed class of the site. Manufacturers offer the same basic-rated machine with different rotor diameters and tower heights to accommodate the certified resource characterization of the specific site. These options are targeted at delivering a turbine that balances both energy capture and reliability in order to ensure cost-effective energy production over the designed lifetime, which is typically 20 years.

The manufacturing capacity of the components needed to support these large machines must have the needed flexibility to support the various options offered by the manufacturers. Unlike other key components such as generators and gearboxes, wind blades can require plant modularity, given the size of the articles and the capital intensive molds that must be available to support projected orders.

Focusing on 2009, when nearly 10GW were installed, the raw materials that were needed to manufacture the diverse set of components can sometimes strain the system and obligate manufacturers to lock in large amounts of supply (~175M lbs of fiberglass). This favors large manufacturers, of course, who have both the capital backing and reputation to be able to lock in both prices and large quantities of materials or components.

Independent of supply, the economic downturn has increased the focus on reliability. Companies and research institutions focus on technology improvements that not only improve the efficiency of the machine, but also focus on improving the reliability and availability of the asset. As the industry has matured over the past 30-plus years, both the technology and methodology used to design and evaluate components has increased substantially, but the materials and manufacturing processes have improved as well.

As an example, several manufacturers have developed blade designs that require carbon fiber for lightweight and stiffness constraints, while others continue to use lower-cost fiberglass given experience and manufacturing infrastructure. Although both methodologies have proven to be successful, balancing the economic benefit of the innovations while preserving or enhancing reliability will be the innovation filter for years to come.

There is an immense set of technology options that can potentially improve wind systems such as condition health monitoring systems, distributed sensor networks, and advance materials options such as nano particles to strengthen local areas, etc., but evaluating and balancing these technologies on an economic basis is key. It is difficult to predict what the next generation of technologies will bring to this industry, but we can be certain that as it continues to mature and leverage technologies from other sectors the resulting turbines will be smarter, more efficient, and they will represent a significant percentage of our energy mix.